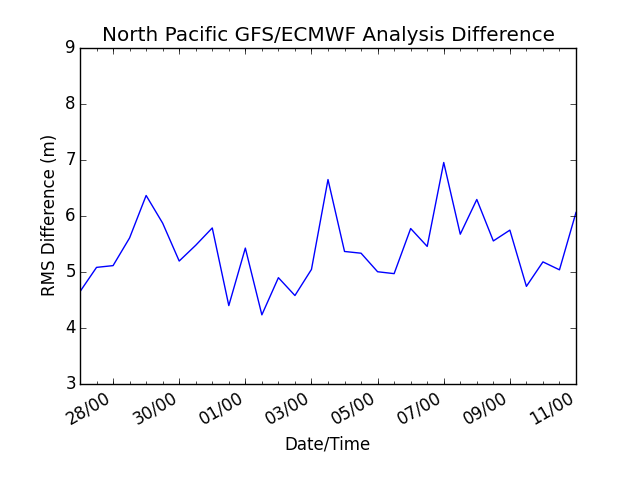
Swanson and Roebber (2008) showed that analysis error over the North Pacific leads to greater forecast uncertainty downstream over North America. The current GFS/ECMWF 500-mb height differences over the North Pacific are provided to augment the energetics/wave packet analyses.
| 180W-60W | 120W-0 | 60W-60E | 0-120E | 60E-180E | 120E-120W | |
|---|---|---|---|---|---|---|
| Eddy Kinetic Energy | ||||||
| Eddy Kinetic Energy Advection by Eddy Wind | ||||||
| Ageostrophic Geopotential Flux Convergence | ||||||
| Baroclinic Conversion | ||||||
| Barotropic Conversion | ||||||
| Wave Packet Envelope Function (C. Demod.) | ||||||
| Wave Packet Envelope Function (Zimin) | ||||||
| Hovmöller Diagram of Ageo. Geop. Flux Conv.. | ||||||
| Hovmöller Diagram of Baroclinic Conversion | ||||||
| Hovmöller Diagram of Barotropic Conversion | ||||||
| Hovmöller Diagram of Wave Packet Env. Func. CD | ||||||
| Hovmöller Diagram of Wave Packet Env. Func. Z | ||||||
| 180W-60W | 120W-0 | 60W-60E | 0-120E | 60E-180E | 120E-120W | |
|---|---|---|---|---|---|---|
| Eddy Kinetic Energy | ||||||
| Eddy Kinetic Energy Advection by Eddy Wind | ||||||
| Ageostrophic Geopotential Flux Convergence | ||||||
| Baroclinic Conversion | ||||||
| Barotropic Conversion | ||||||
| Wave Packet Envelope Function (C. Demod.) | ||||||
| Wave Packet Envelope Function (Zimin) | ||||||
| Hovmöller Diagram of Ageo. Geop. Flux Conv. | ||||||
| Hovmöller Diagram of Baroclinic Conversion | ||||||
| Hovmöller Diagram of Barotropic Conversion | ||||||
| Hovmöller Diagram of Wave Packet Envl. Func. CD | ||||||
| Hovmöller Diagram of Wave Packet Envl. Func. Z | ||||||