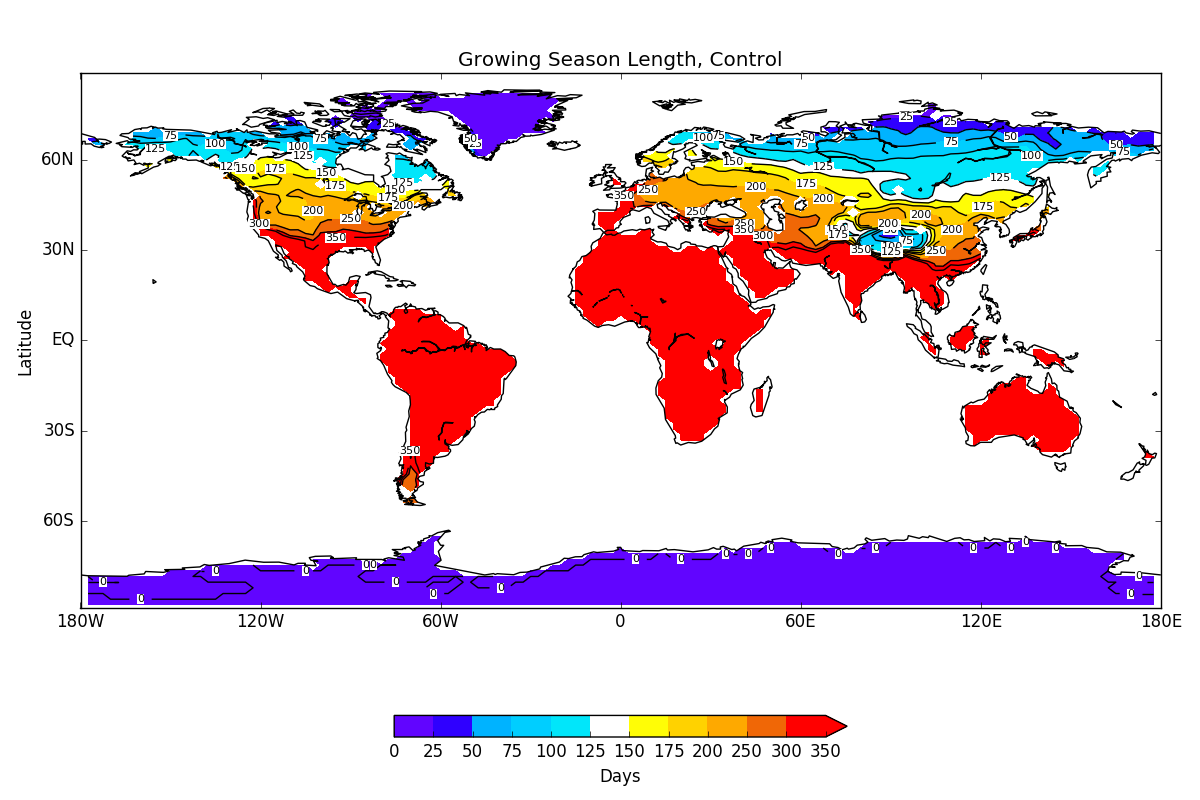
where the growing season length is defined as the longest period of time between days where the minimum temperature dropped below freezing. For the northern hemisphere, the period of time was January 1st to December 31st, and for the southern hemisphere it was June 1st to May 31st of the following year, so that the growing season was in the middle of the time periods selected.
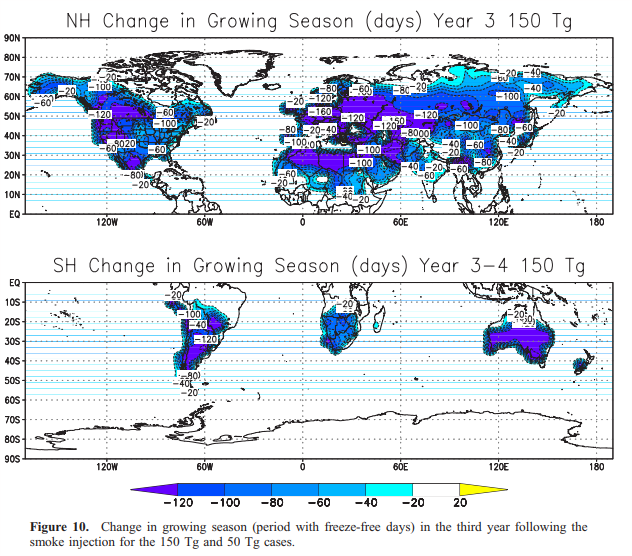
To replicate this figure from the 2007 paper, I take the anomaly of the 150 Tg growing season with respect to the control. For reference, was this:
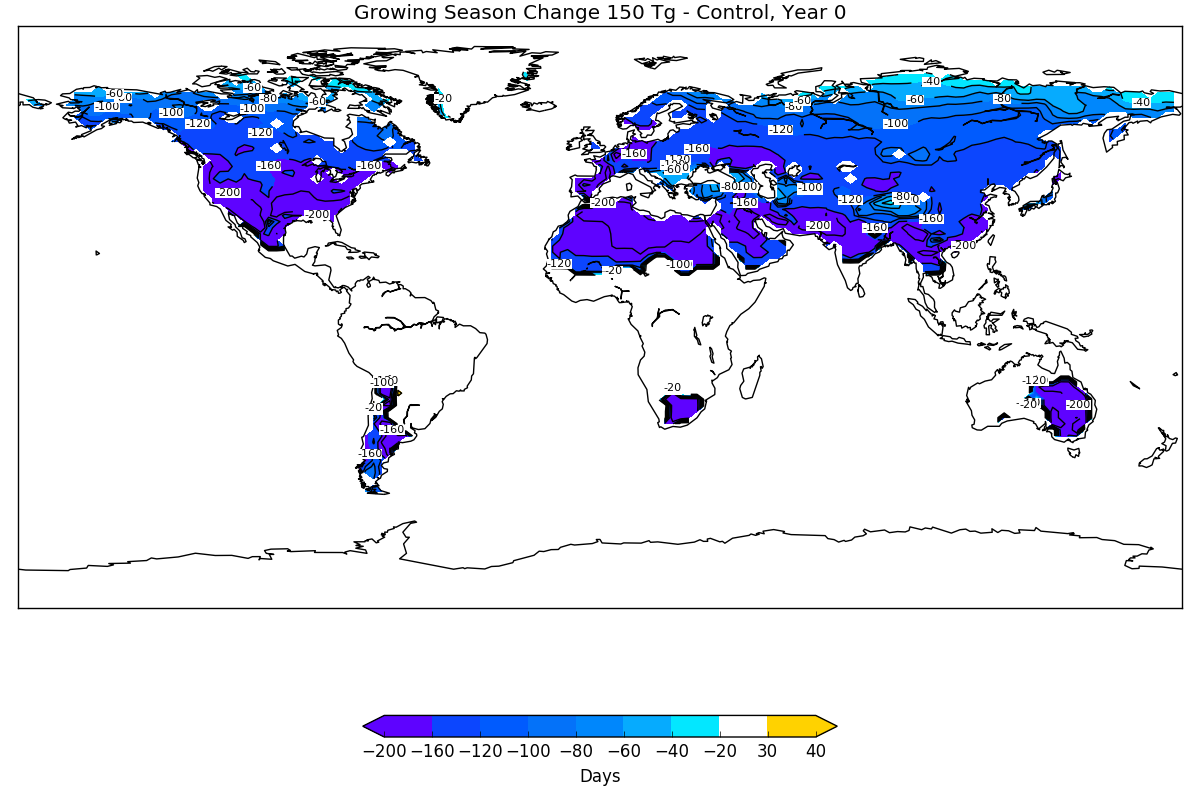
Year 0 growing season:
injection at the beginning of time period analyzed for northern hemisphere, injection at the start of time analyzed for southern hemisphere.
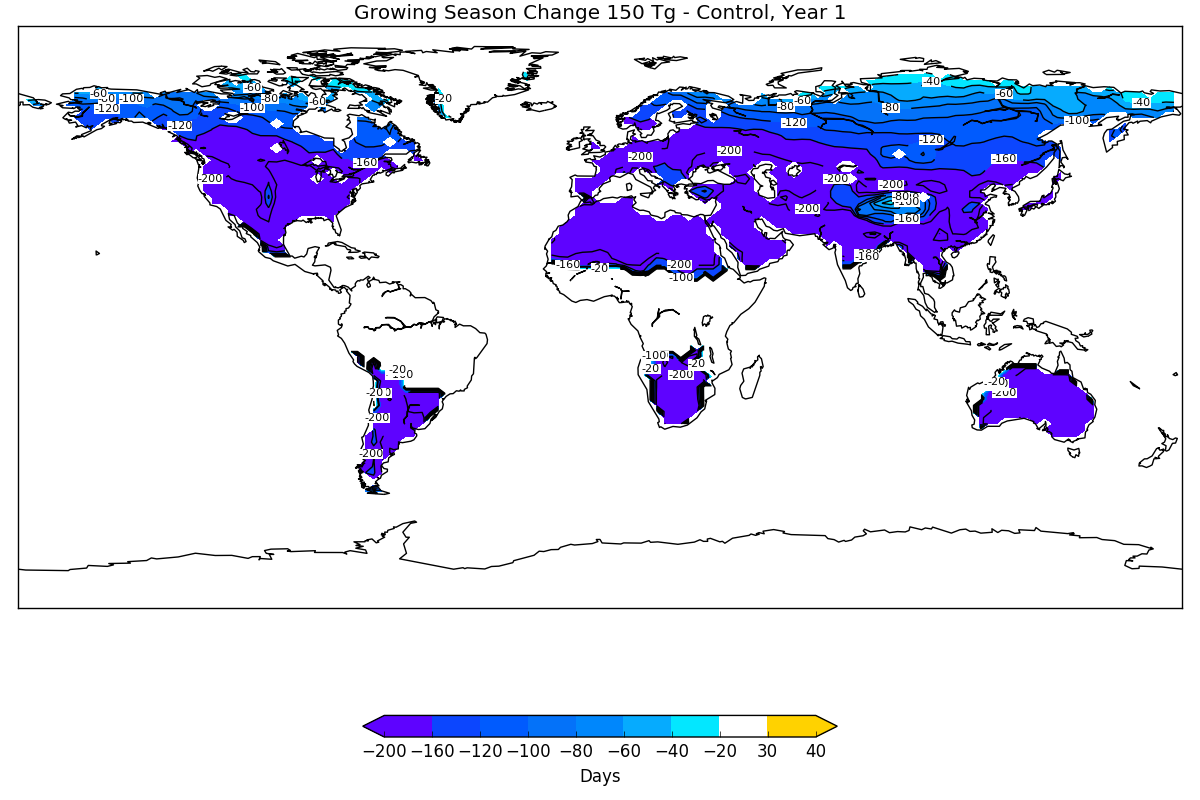
Year 1 growing season
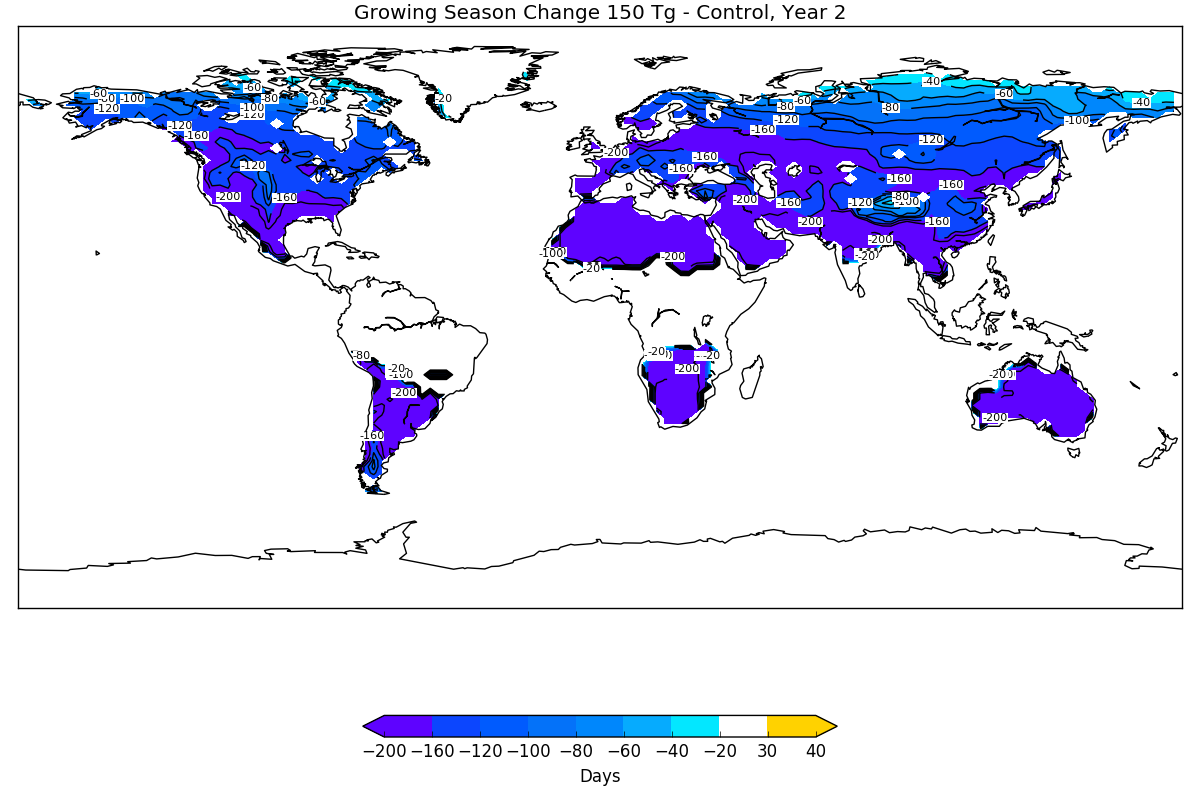
Year 2 growing season
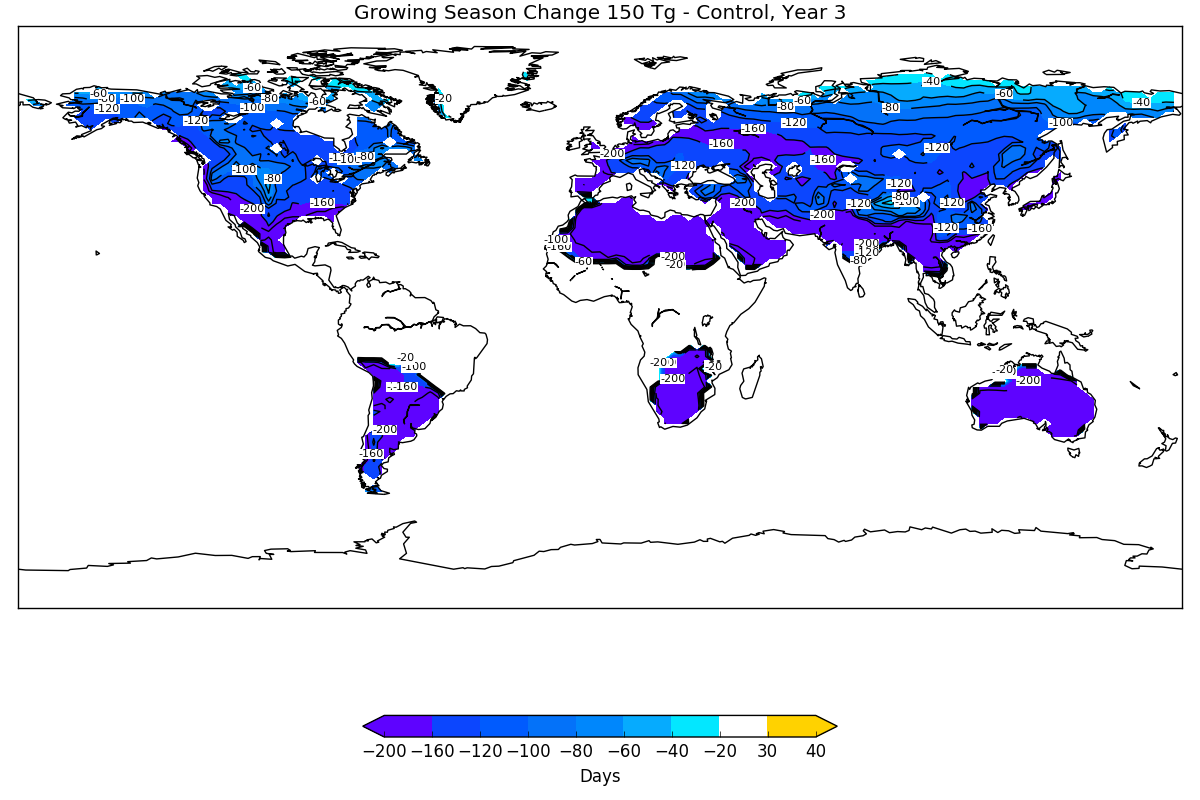
Year 3 growing season
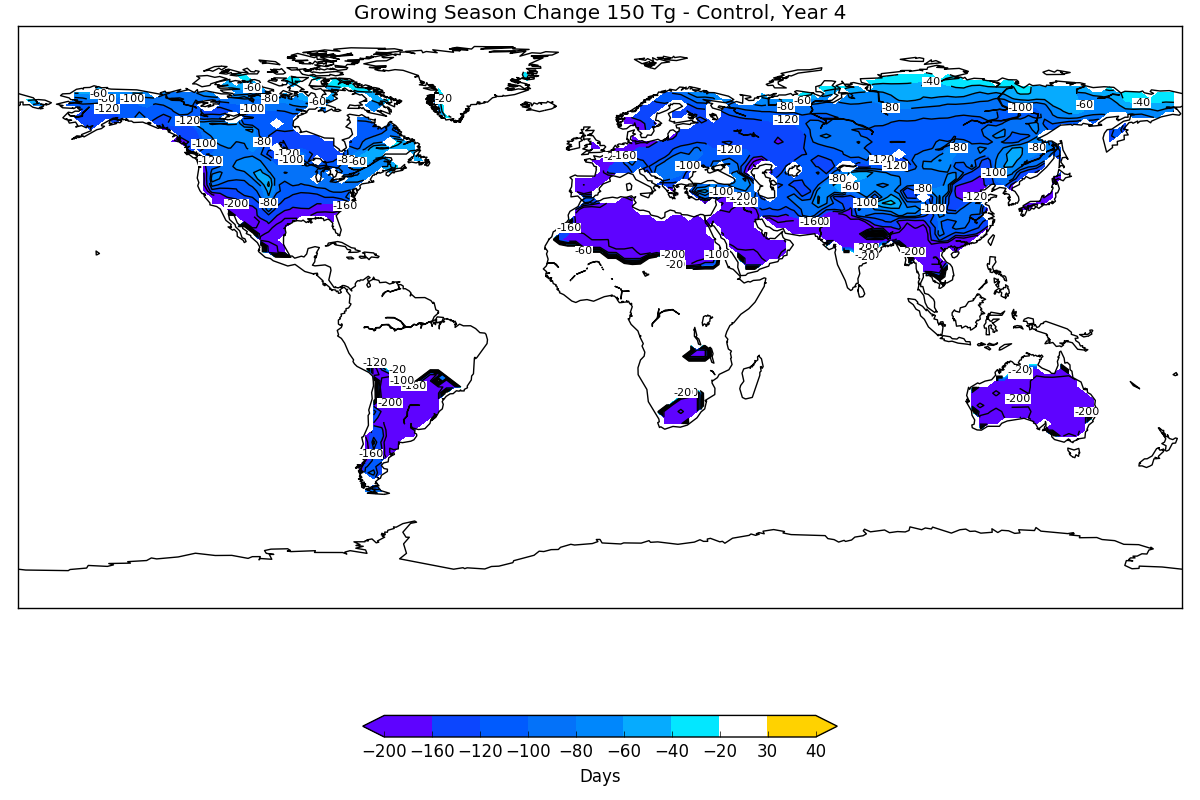
Year 4 growing season
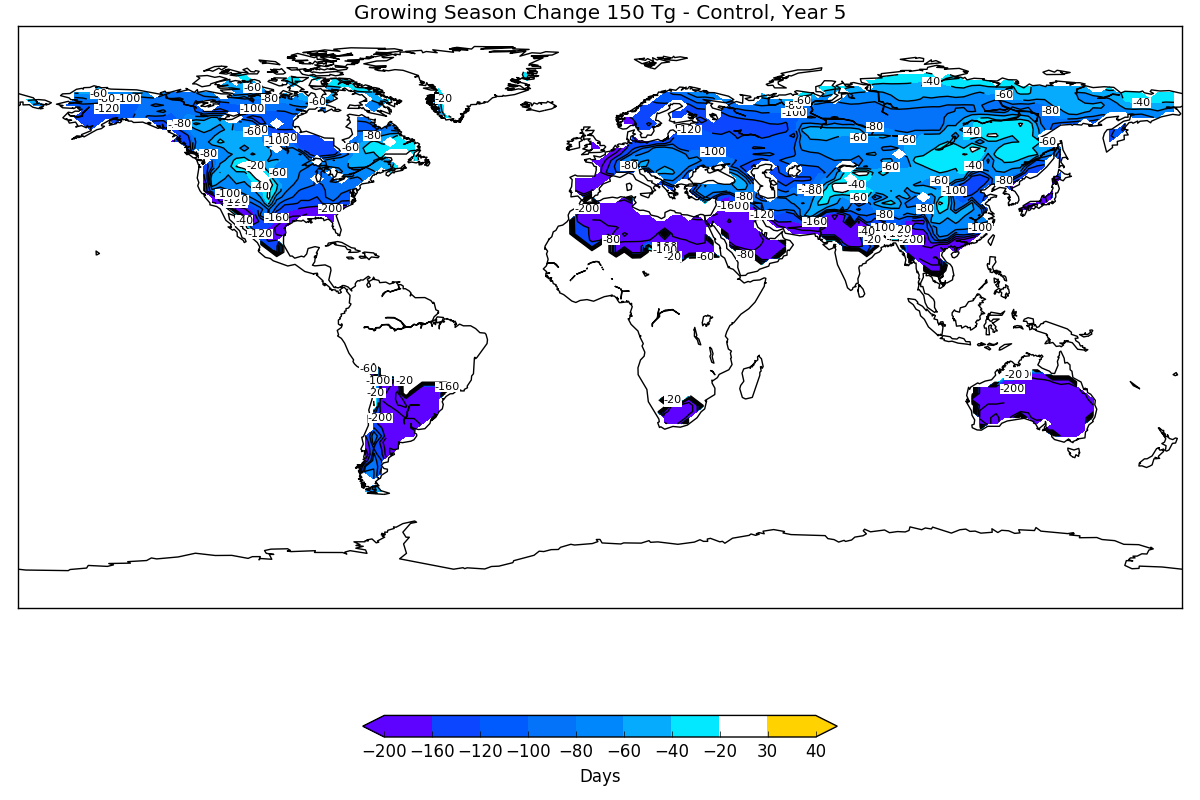
Year 5 growing season