
2. Calculating the Effect of a Strong, Positive Arctic Oscillation (AO)
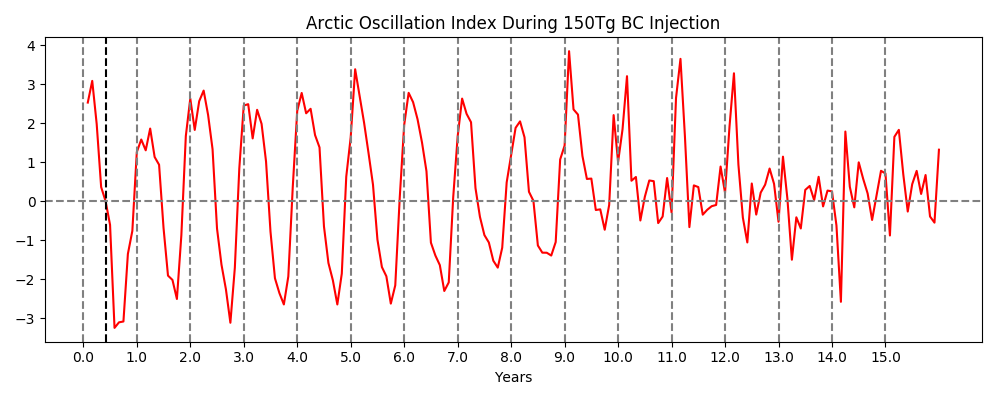
I've hypothesized that this circulation change after a 150 Tg soot injection is a significant driver of a positive surface temperature anomaly over regions of the Arctic, with a possible contribution from added longwave radiation due to the heated soot in the stratosphere. To tease out the temperature signal during an +AO, I isolated winters with a highly positive AO during two control runs: nw_cntrl_03 (21 years) and B2000_nmeteor_cntrl_def (42 years). A highly positive AO is defined as being greater than 1.0. This will allow us to examine the effect of an AO on surface temperature, and see how this compares with what is observed in the 150 Tg soot injection model runs.
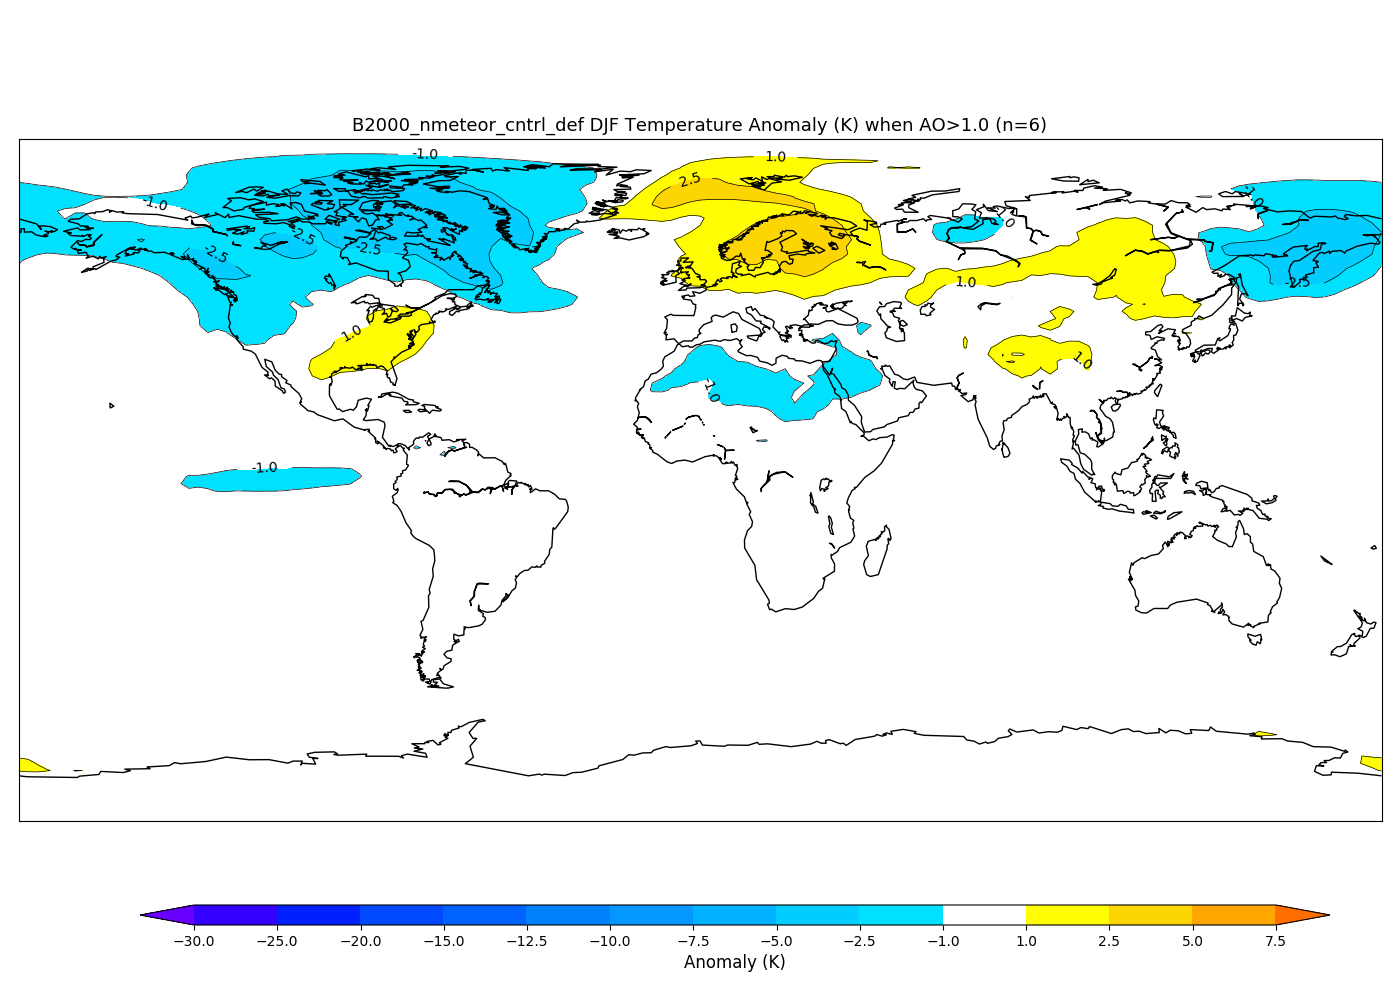
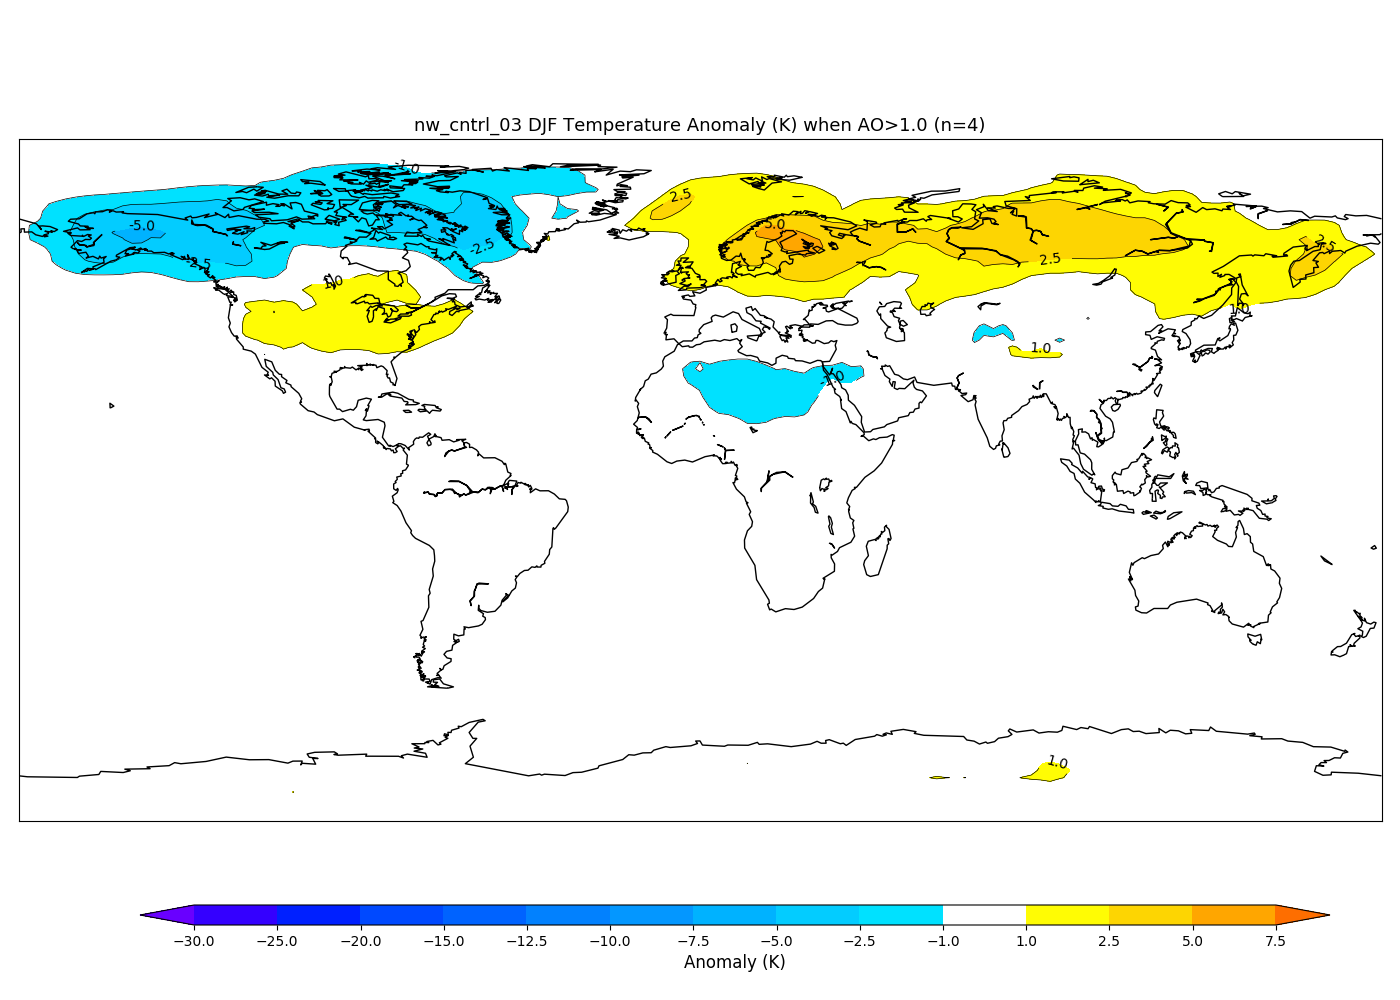
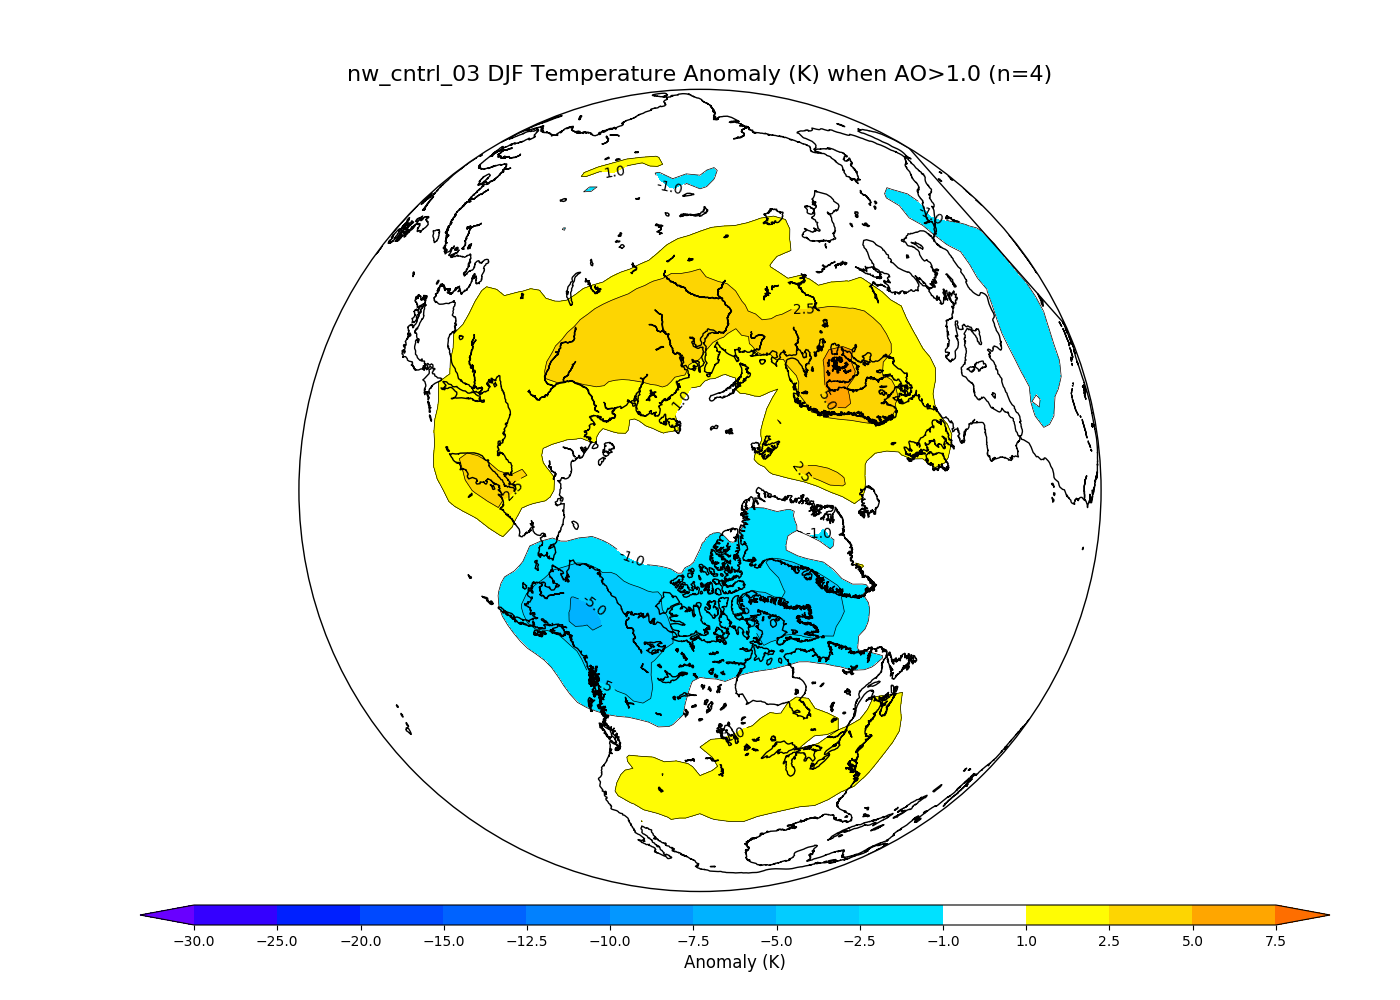
Below I isolated every DJF from the control runs with an AO index greater than 1.0, and calculated the average 2m temperature anomaly from those same months. Both B2000_nmeteor_cntrl_def (42 years, 6 winters with an AO >1.0) and nw_cntrl_03 (21 years, 4 winters with an AO >1.0) demonstrate that a strong +AO atmospheric circulation leads to a positive temperature signal over similar areas with this response after a 150 Tg soot injection.
Temperature Anomaly (K) When AO > 1.0 for B2000_nmeteor_cntrl_def (left) and nw_cntrl_03 (right):
3. Temperature Response to a 150 Tg Soot Injection
There are some differences between the two control runs, but because nw_150_07 is based on nw_cntrl_03, the nw_cntrl_03 composite will be used moving forward. Next, I compare the nw_cntrl_03 temperature anomaly-AO composite (n=4 years) and the observed temperature anomaly during the 150 Tg soot injection (on the right). The pattern is similar in Europe and Eurasia. The temperature pattern following the soot injection is shifted north and is stronger than that of the control composite plot on the left. The temperature response from the soot injection run could certainly be enhanced by the longwave radiative effect of soot, but more investigation is warranted.
Temperature Anomaly (K) When AO > 1.0 for nw_cntrl_03 (left) and DJF Year 1 Temperature Anomaly (K) for 150 Tg soot injection (right): >
*plots on the bottom and top are the same data, just with different projections
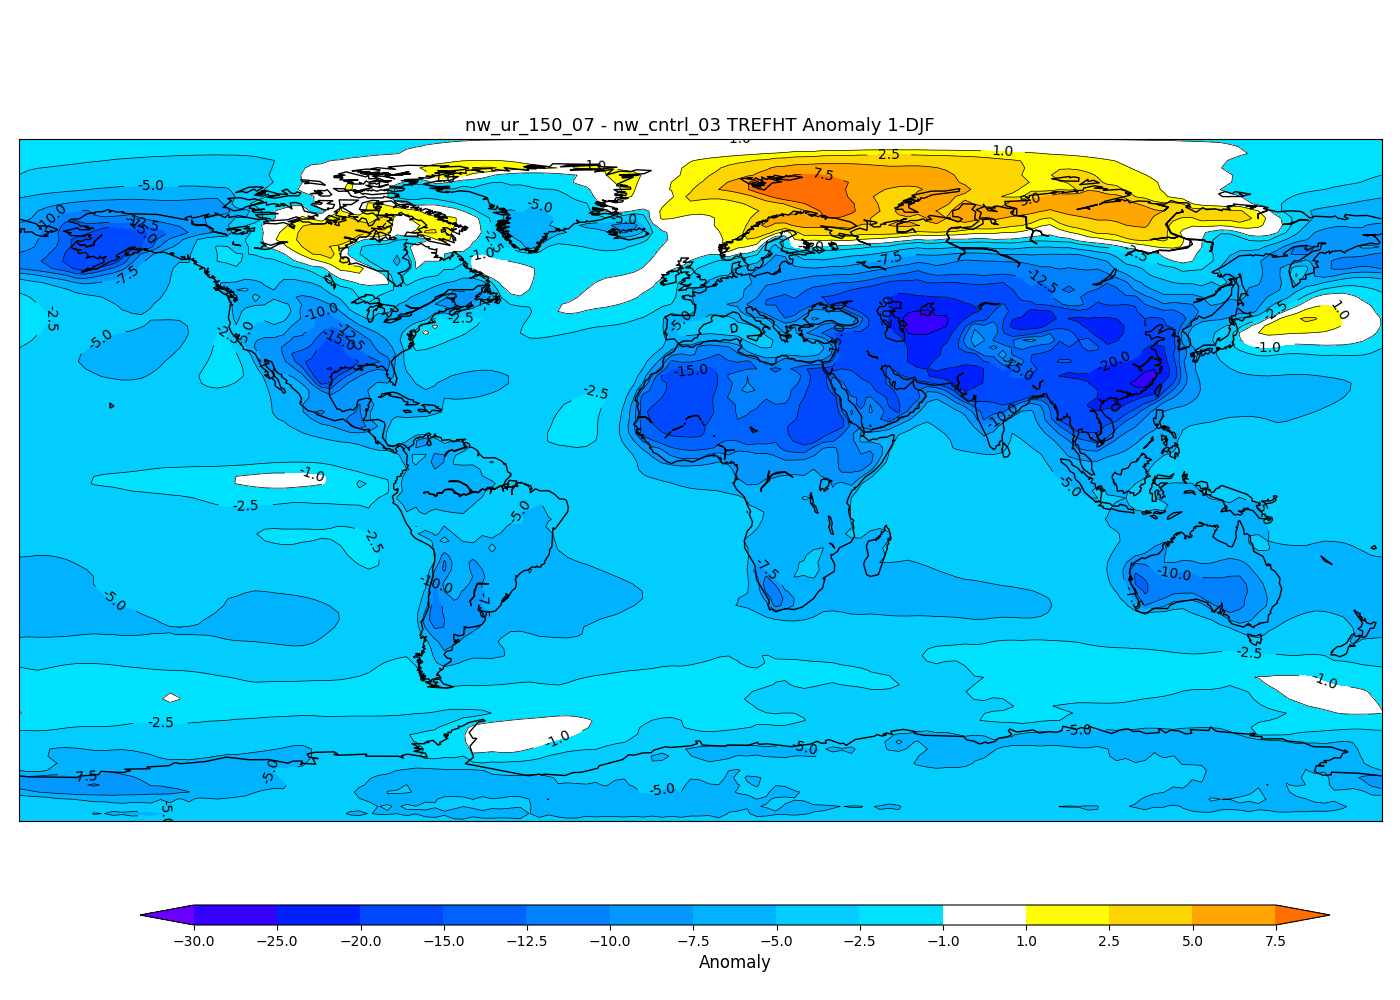
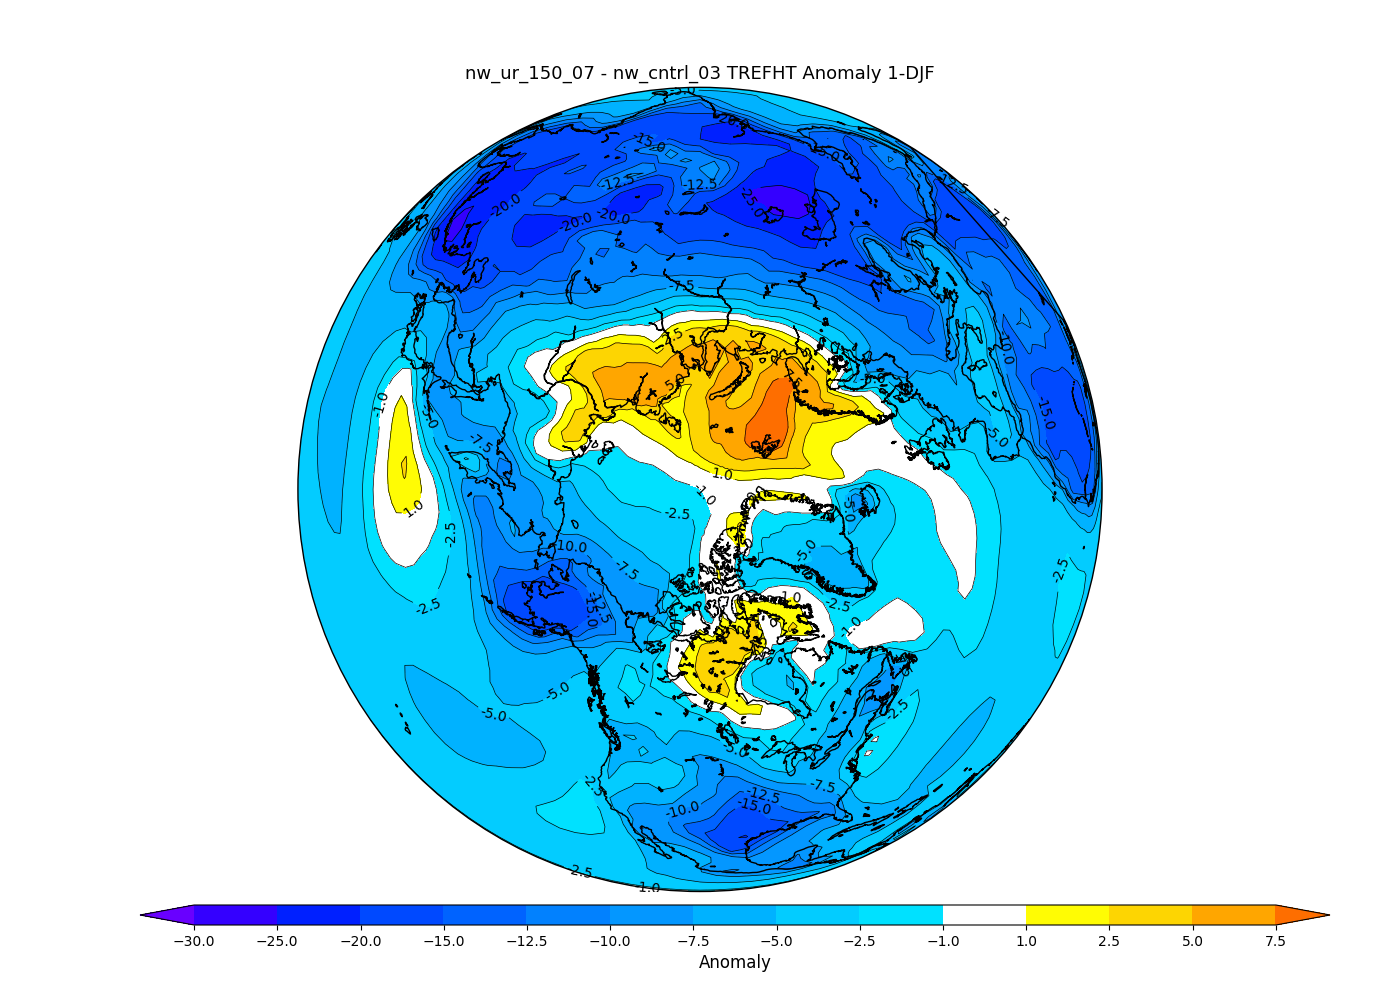
The difference between the left and right above plots may be interpreted as the temperature effect from the longwave radiation soot, which is up to 5 degrees C in some parts of the Arctic. A couple of things to consider:
1) The average AO in the temperature composite of AO winters >1.0 is around 1.3, which is weaker than the winters in the 150 Tg run, which can influence the strength and placement of the temperature response. One can reasonably expect an even stronger circulation response with 150 Tg of soot in the stratosphere, and thus potentially a stronger and more northerly temperature response.
2) On the other hand, the reduced incoming shortwave radiation upstream of the areas we are focusing on will undoubtedly lead to cooling, which can reduce the temperature response associated with the +AO.
A lack of winters with an AO greater than 1.5 in the control runs impedes our ability to scale the temperature response with even higher AO values, and I have not calculated the effect that a cooling Atlantic Ocean will have on the warming in Europe.
4. Downwelling Longwave Radiation in the Arctic After a 150 Tg Soot Injection
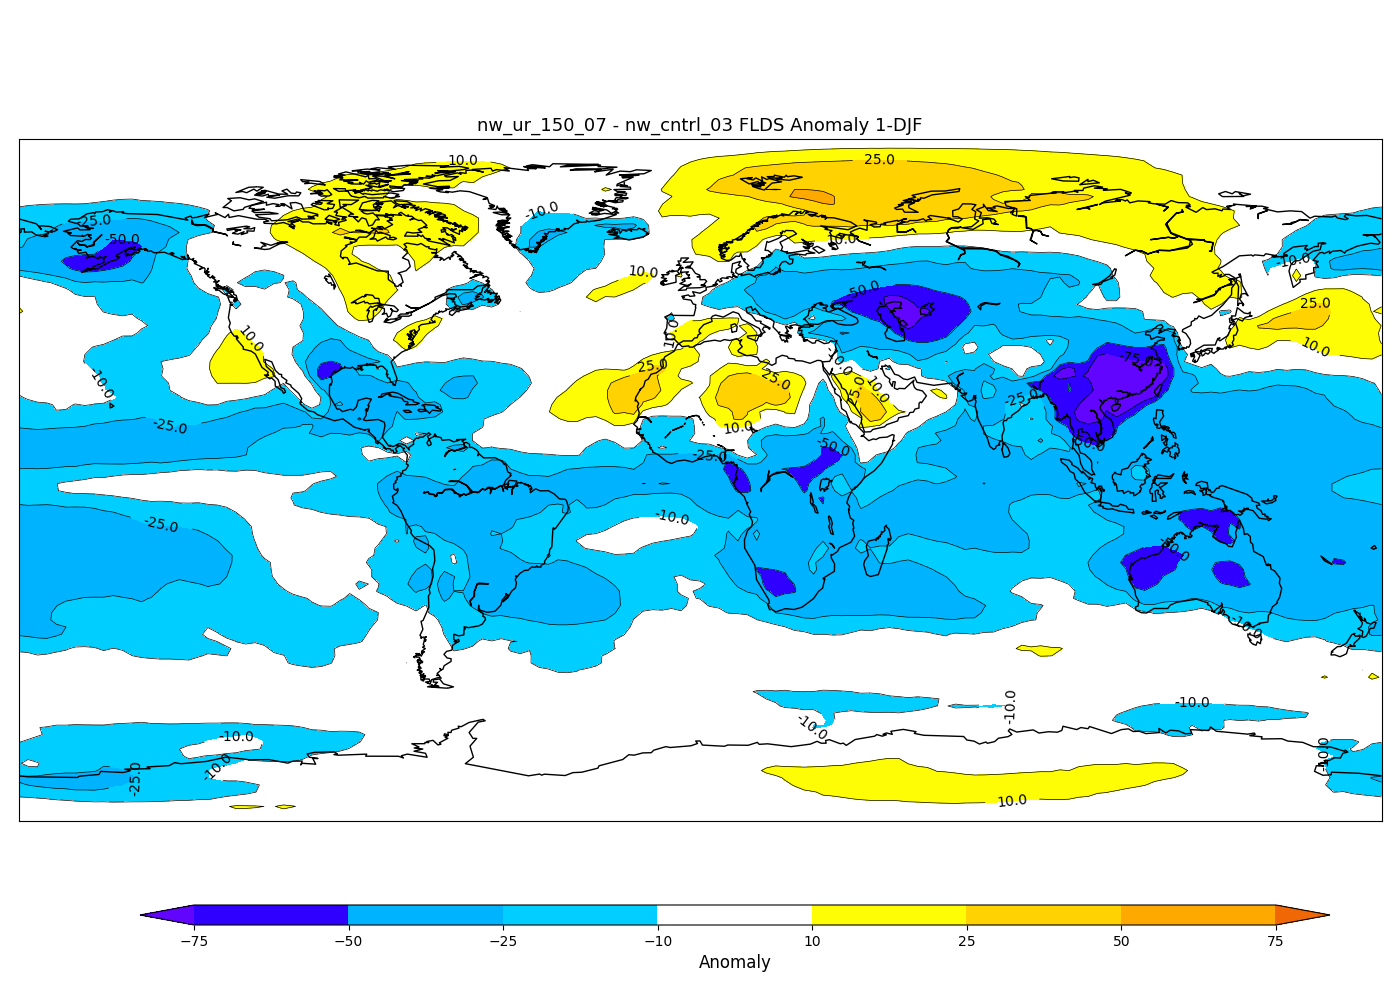
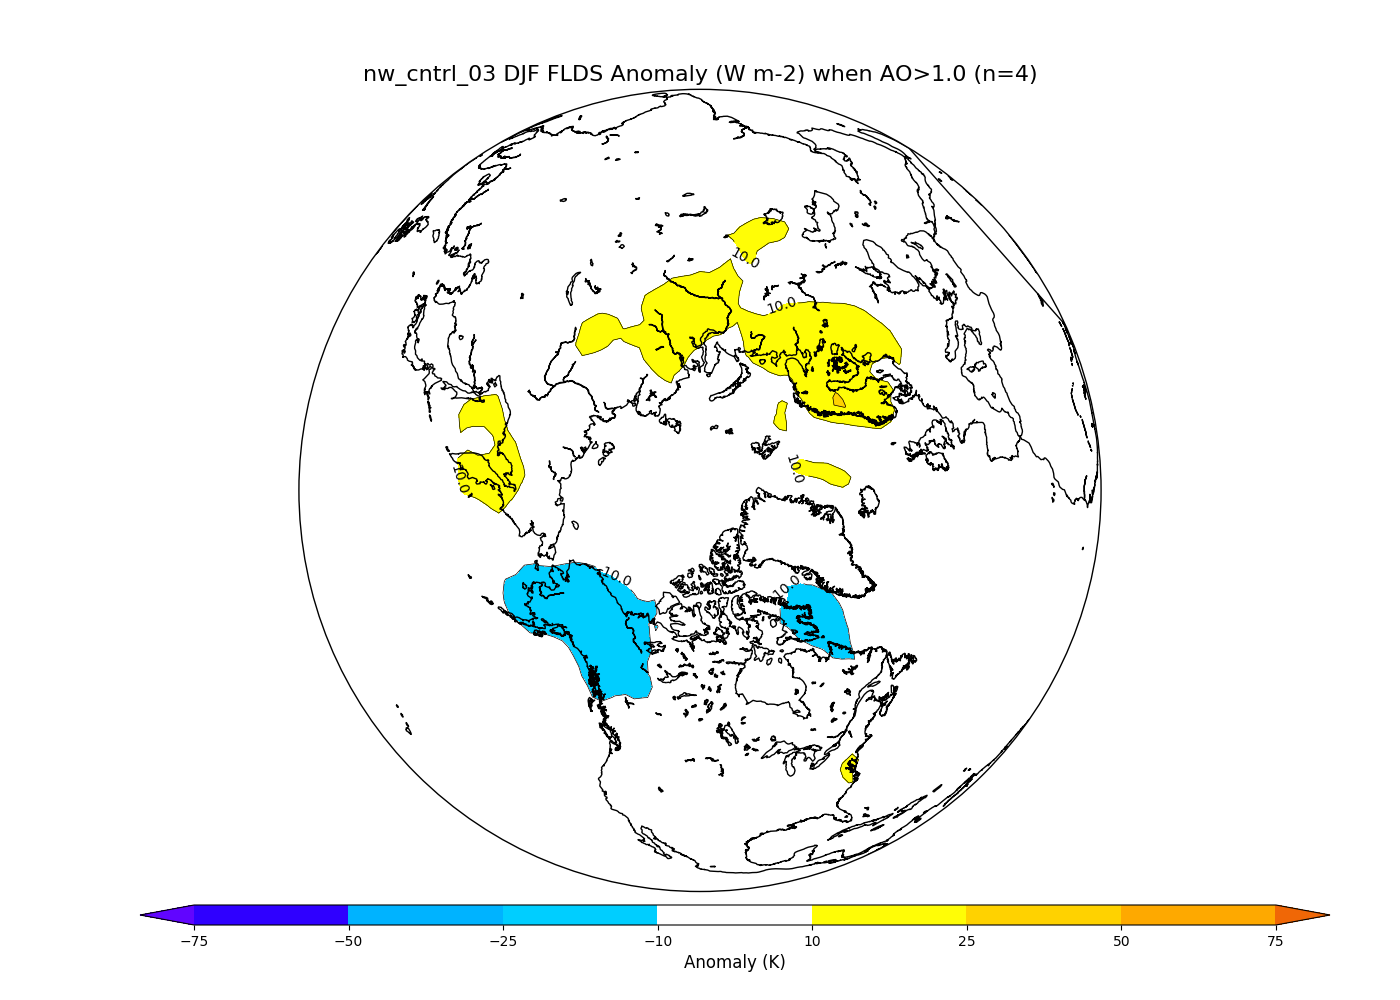
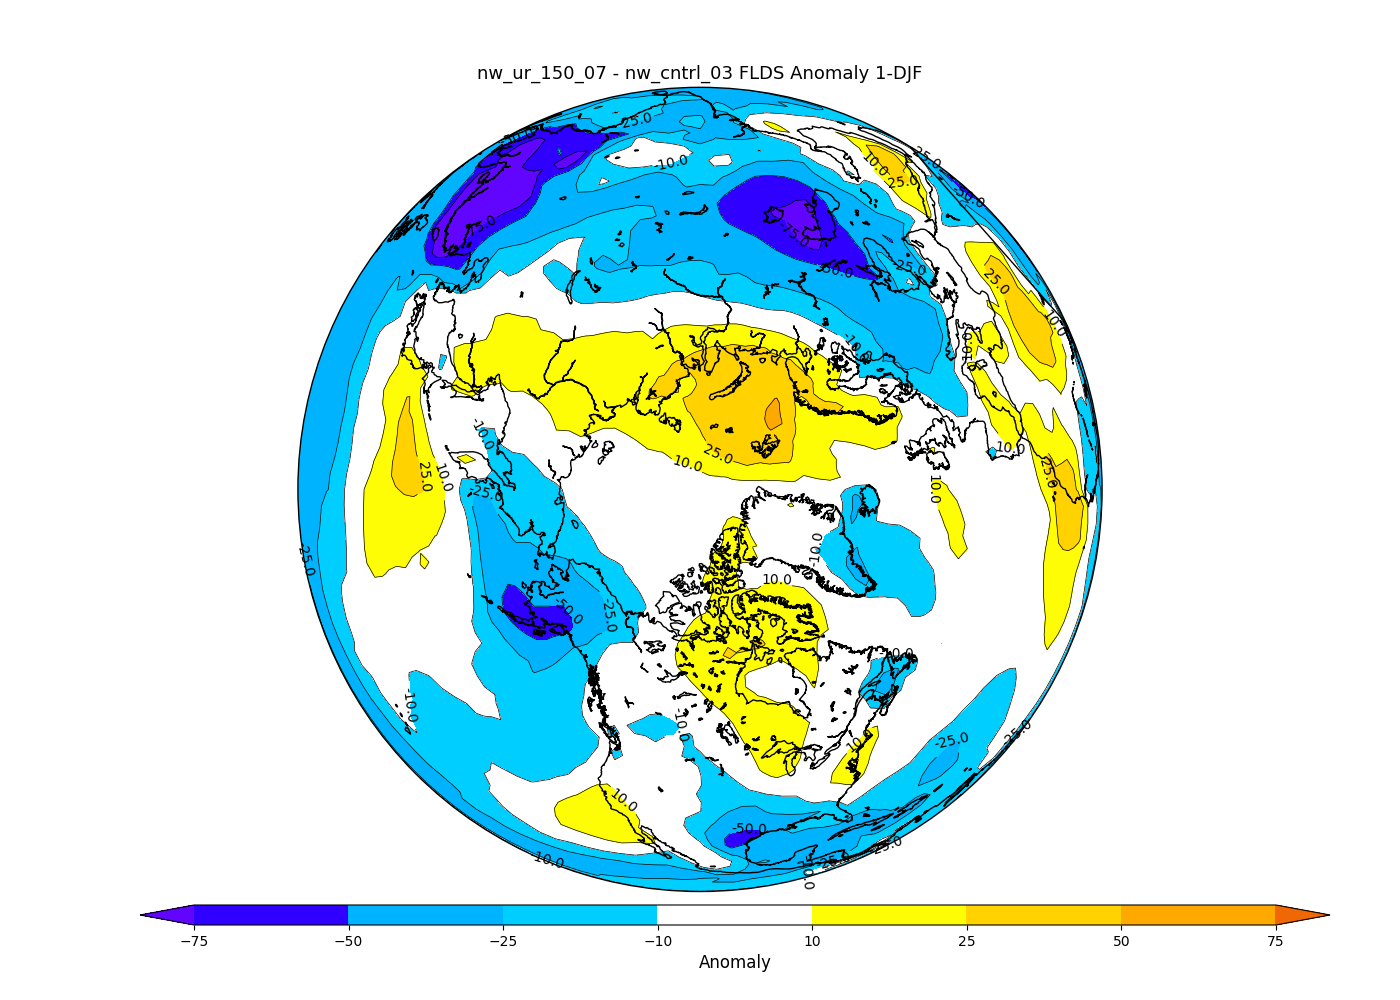
To try and disentangle the effect of circulation changes and the effects of longwave radiation being emitted from soot, I examine FLDS (downwelling longwave radiation at the surface), which can be used to measure the amount of radiation downwelling from soot in the upper troposphere and stratosphere. FLDS is influenced by clouds and a warmer lower atmosphere as well. The left plot below demonstrates that during the average of all of the highly positive AO winters in the control, there is a >10 W/m2 FLDS anomaly over the same areas of Europe and Eurasia as a result of the warmer conditions brought on by the circulation changes. Explaining some of this, is a modest change (5-10 W/m2 over Scandinavia, less elsewhere) in LWCF (longwave cloud radiative forcing, not shown) during the +AO winters. The difference between the FLDS-AO composite (left) and the FLDS during the first winter after the soot injection (right) can be interpreted as the effect of downwelling longwave radiation from soot during the first winter. In some spots in the high Arctic, this can be as much as 15-20 W/m^2 of additional energy. However, this can just be an artifact of a lower atmosphere that is warmer due to an even stronger circulation response than what was observed in the sample of control run winters with AOs greater than 1.0.
*colorbar units should be W/m^2 for the plots on the left and K for the right

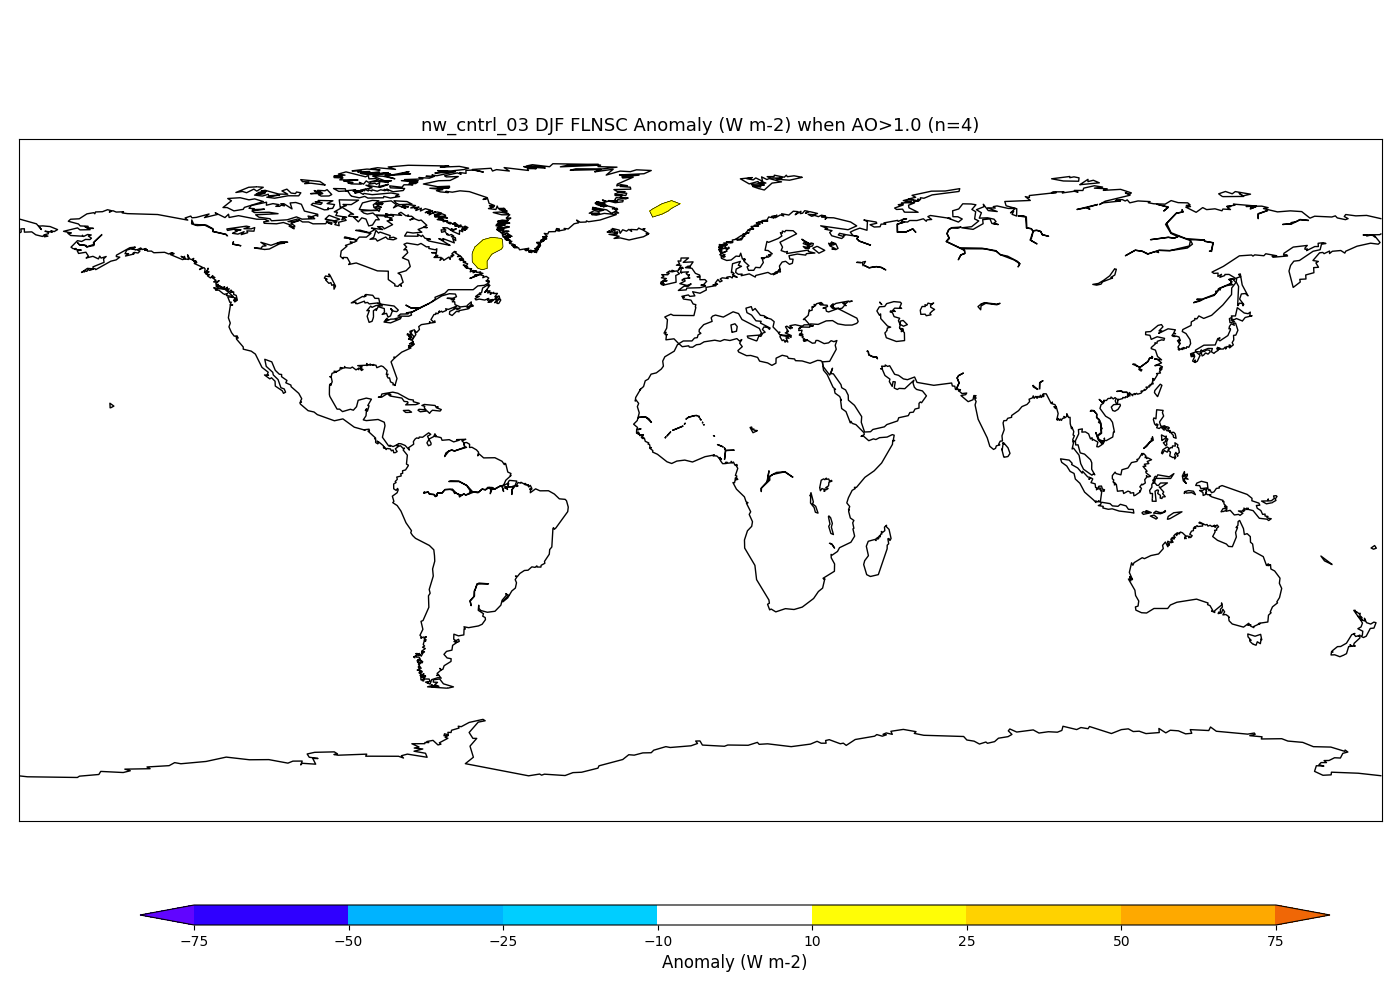
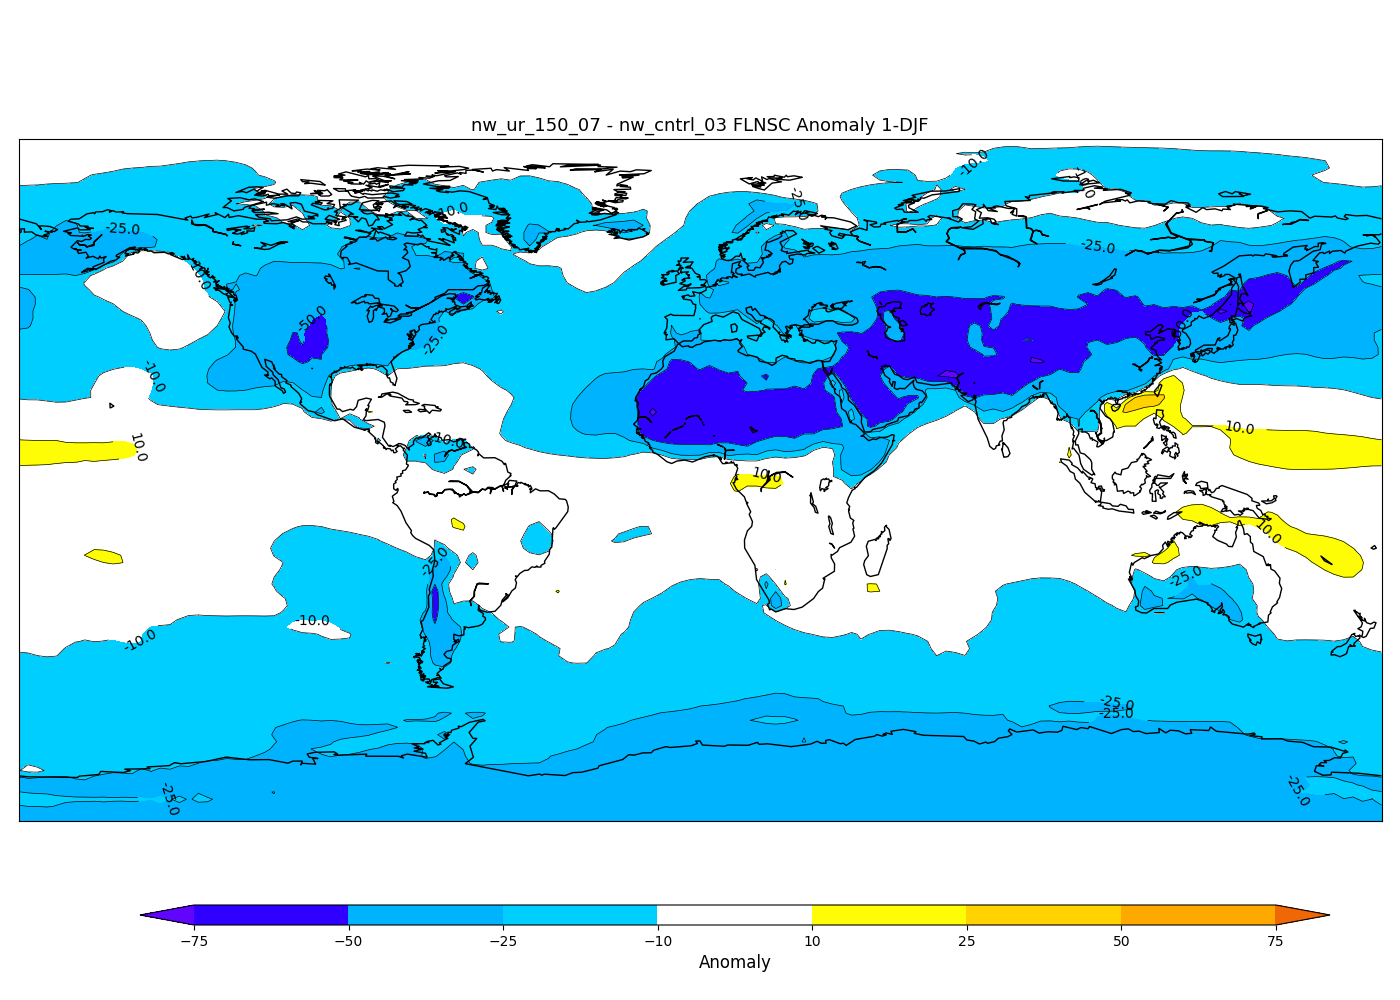
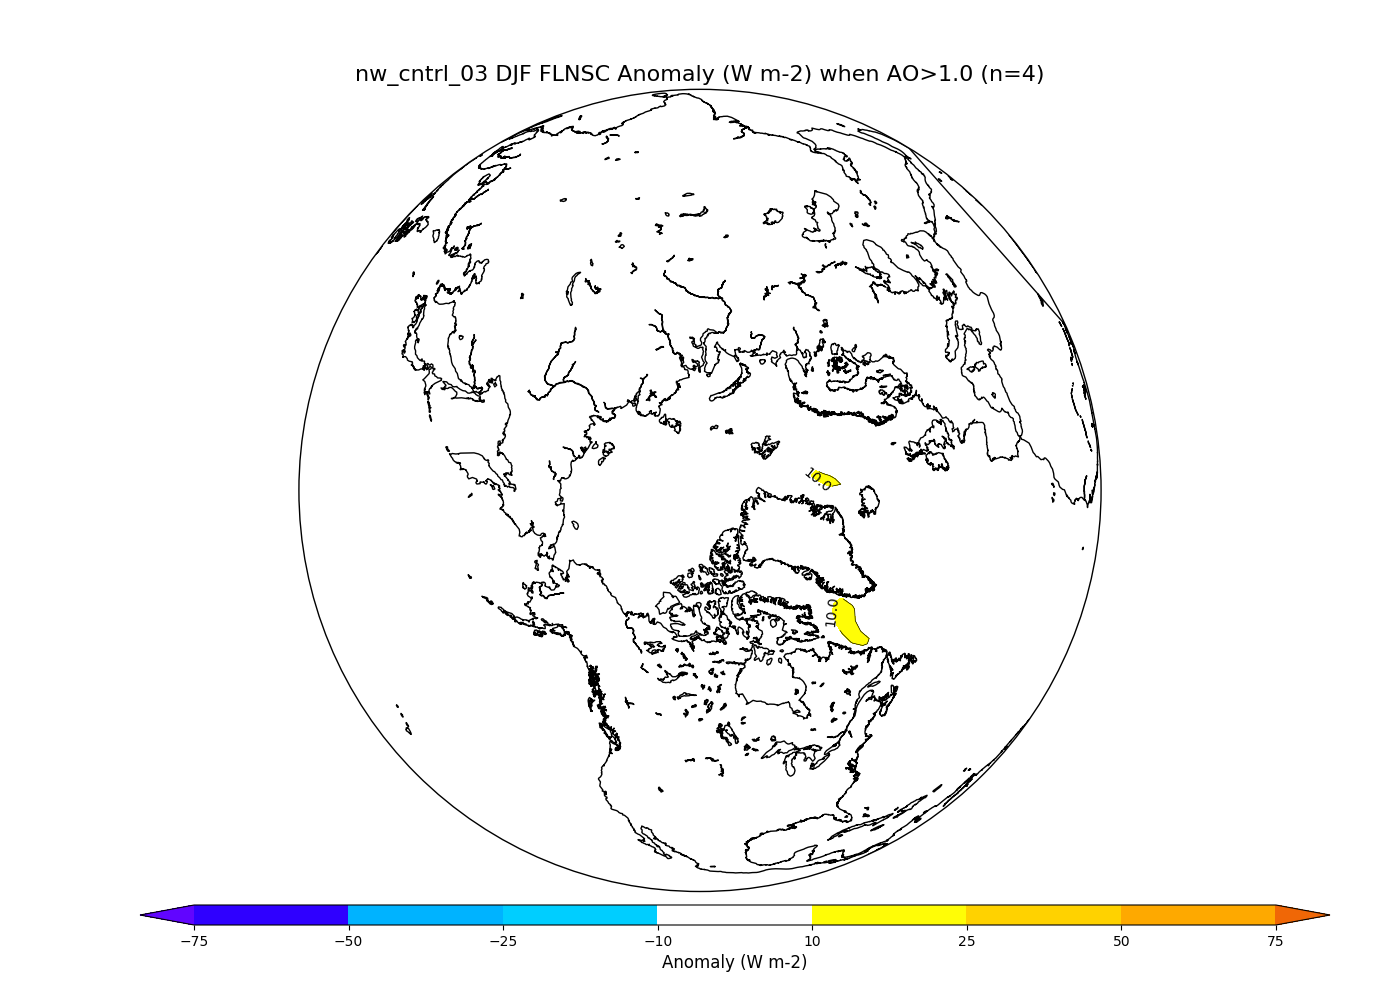
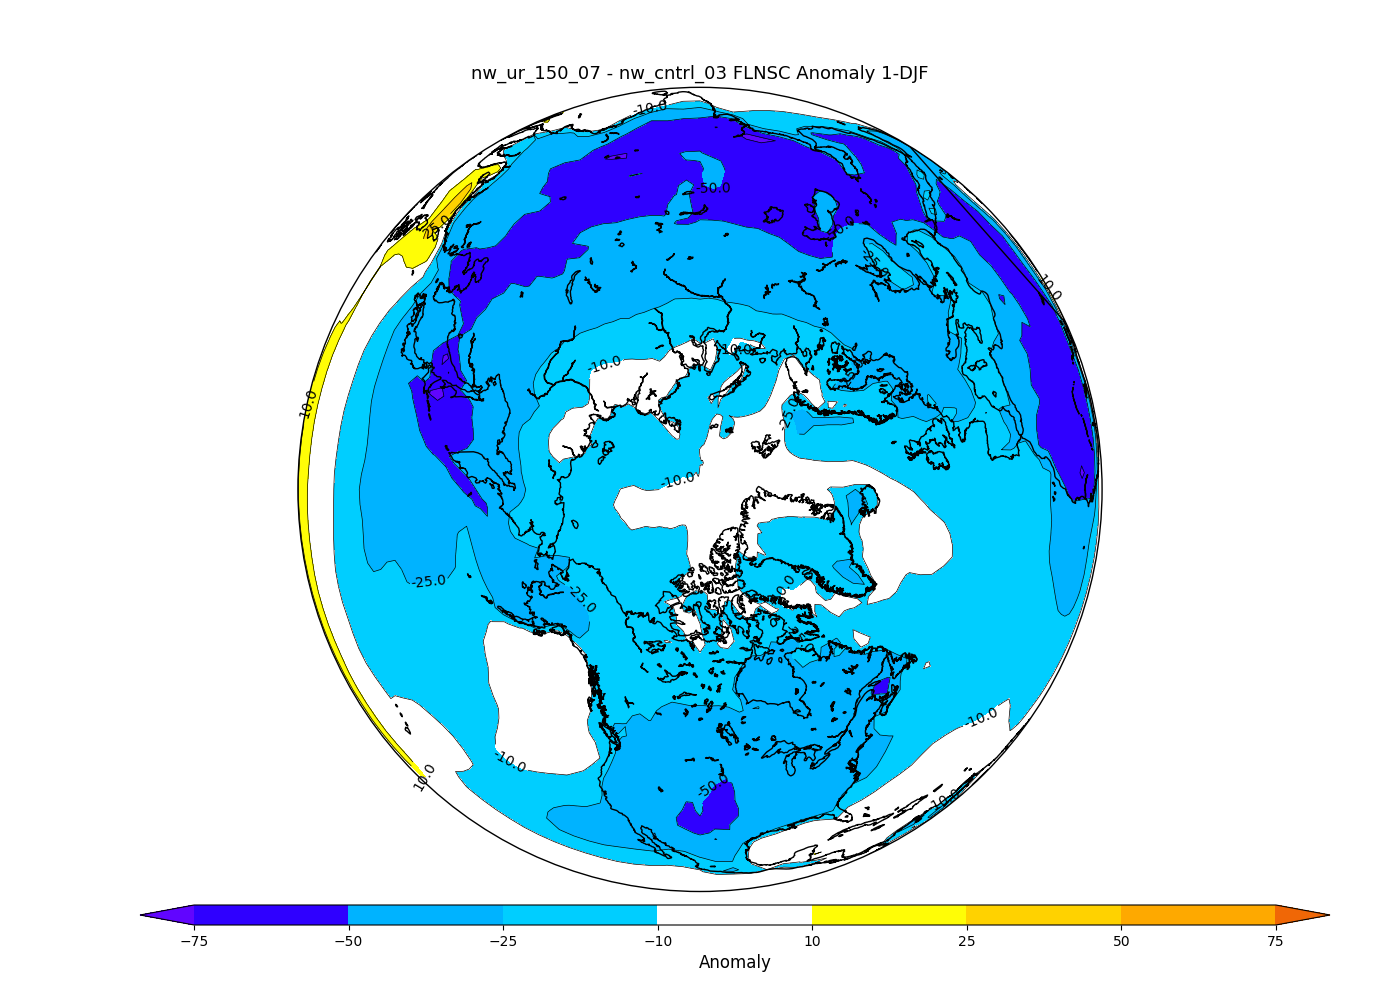
In an attempt to further disentangle circulation effects from longwave radiation effects, I looked at FLNSC, or the CLEAR SKY net longwave radiation at the surface, removing any warming influence of clouds over much of the Arctic regions. FLNSC anomaly during n=4 winters with an AO > 1.0 shows a negligible effect of the AO on the clearsky net longwave radiation at the surface (figure on the left). This shows there there is very little change in downwelling longwave radiation after clouds are removed during a typical DJF in nw_cntrl_03 with an +AO > 1.0 (left figure below). This remains the case following the injection of soot into the stratosphere (right figure below). Clearly, most areas show a negative FLSNC anomaly because much of the Earth receives drastically reduced insolation as well as a reduction in water vapor in the air.
This supports a greater role of clouds in maintaining warm conditions. If there were large FLNSC values over the area, soot could have been identified as the culprit for the positive FLDS anomalies. However, it could just be stronger advection of warm air that's raising the temperature of the lower atmosphere, as the AO is extraordinarily positive. The role that clouds play in this warming would be hiding its impact on clear sky net longwave flux. It's difficult to conclude that soot has a significant contribution (>10 W/m^2) to downwelling longwave radiation in the absence of clouds, unless the longwave radiation emitted downward by soot is absorbed by clouds and re-emitted to the surface.
I'm unsure exactly how the model is tracking longwave emission from the soot, and if it would get caught-up in the longwave cloud forcing. If that was the case, it would explain the absence of additional longwave radiation from soot being hidden from FLNSC.
6. Conclusion?
Changes in circulation have a noticeable effect on temperature in the Arctic regions during DJF following the injection of soot that mirror the typical responses to a strong, positive AO. I can't rule out the influence of longwave radiation being emitted from black carbon in the upper troposphere based on the difference between the typical FLDS pattern during the control +AO and during the first winter after a soot injection. However, when clouds are removed from the radiation balance, any signal from the control +AO composite disappears, suggesting clouds play an important role. The role of clouds may be masking the radiative effect of soot higher up in the atmosphere based on the variables I've looked at.
Any suggestions to make this analysis more complete are welcome.