nw_150_07 - nw_cntrl_03 analysis of winter warming: response to e-mail
Response in bold
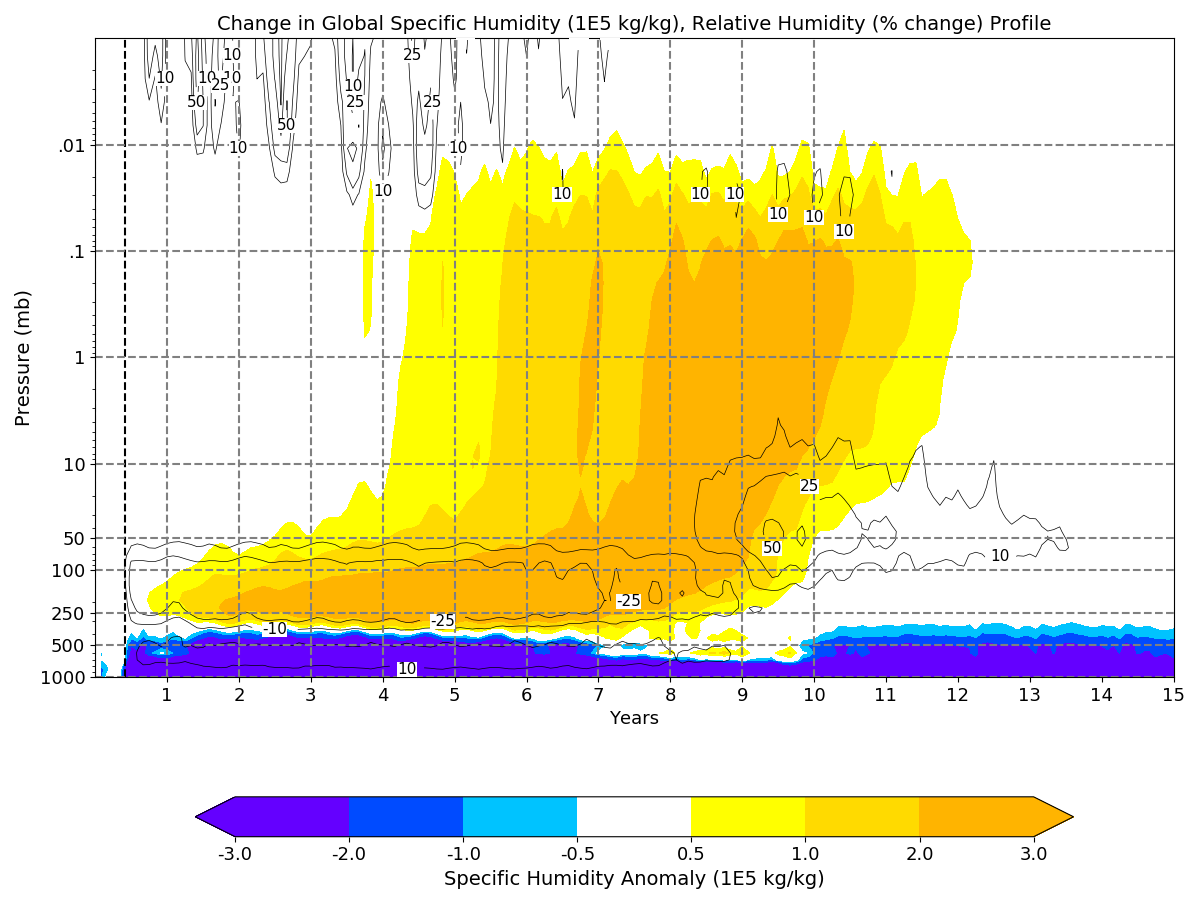
A. It is not the soot that is radiating LW. The soot is heated with astonishing heating rates by the sun, but it quickly transfers that heat to the air. It is the stratospheric air that is radiating the LW. I think your stratosphere may be full of water, which increases the LW. Can you make a plot of the stratospheric water perturbations (ie mixing ratio and relative humidity?) like Chuck has in his PNAS paper? Careful reading of that paper would be good.
A plot of the specific humidity anomaly (1E5 kg/kg, color fill) and relative humidity (%, anomaly, contours) shows the moistening of the stratosphere globally during nw_150_07, which becomes rather significant after the 4th year especially in the upper stratosphere. The stratosphere between 250 hPa and 100 hPa heats up more than it moistens so its relative humidity drops but the specific humidity does increase.
B. I think Fig. 4 in your original paper is the surface temperature anomaly, not the air temperature anomaly. If so it is a good place to start the analysis, because the ground temperature is controlled only by local energy balances.
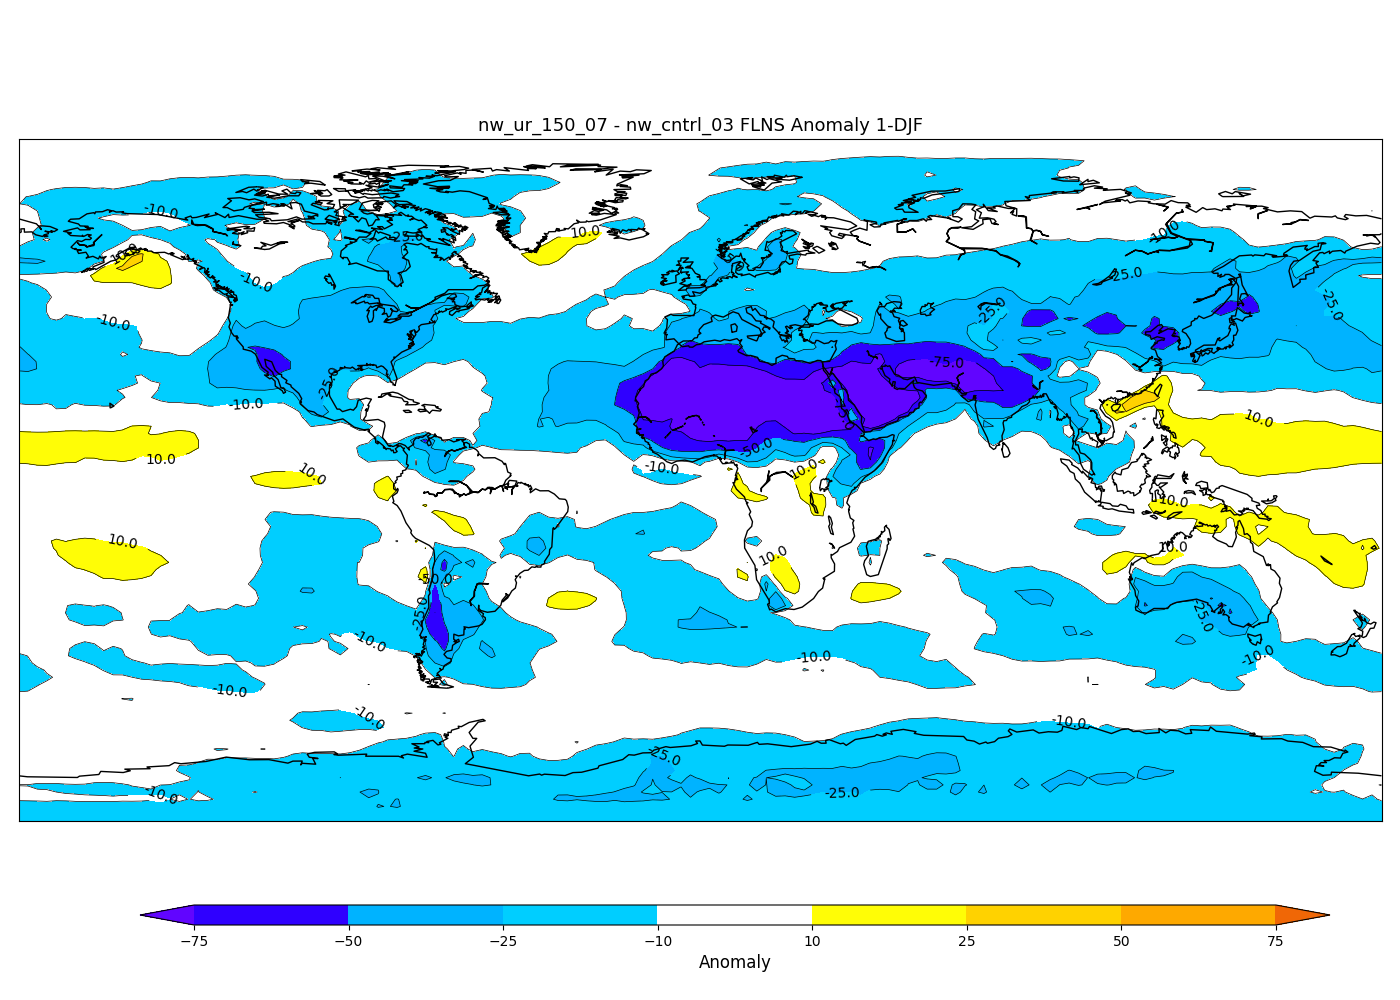
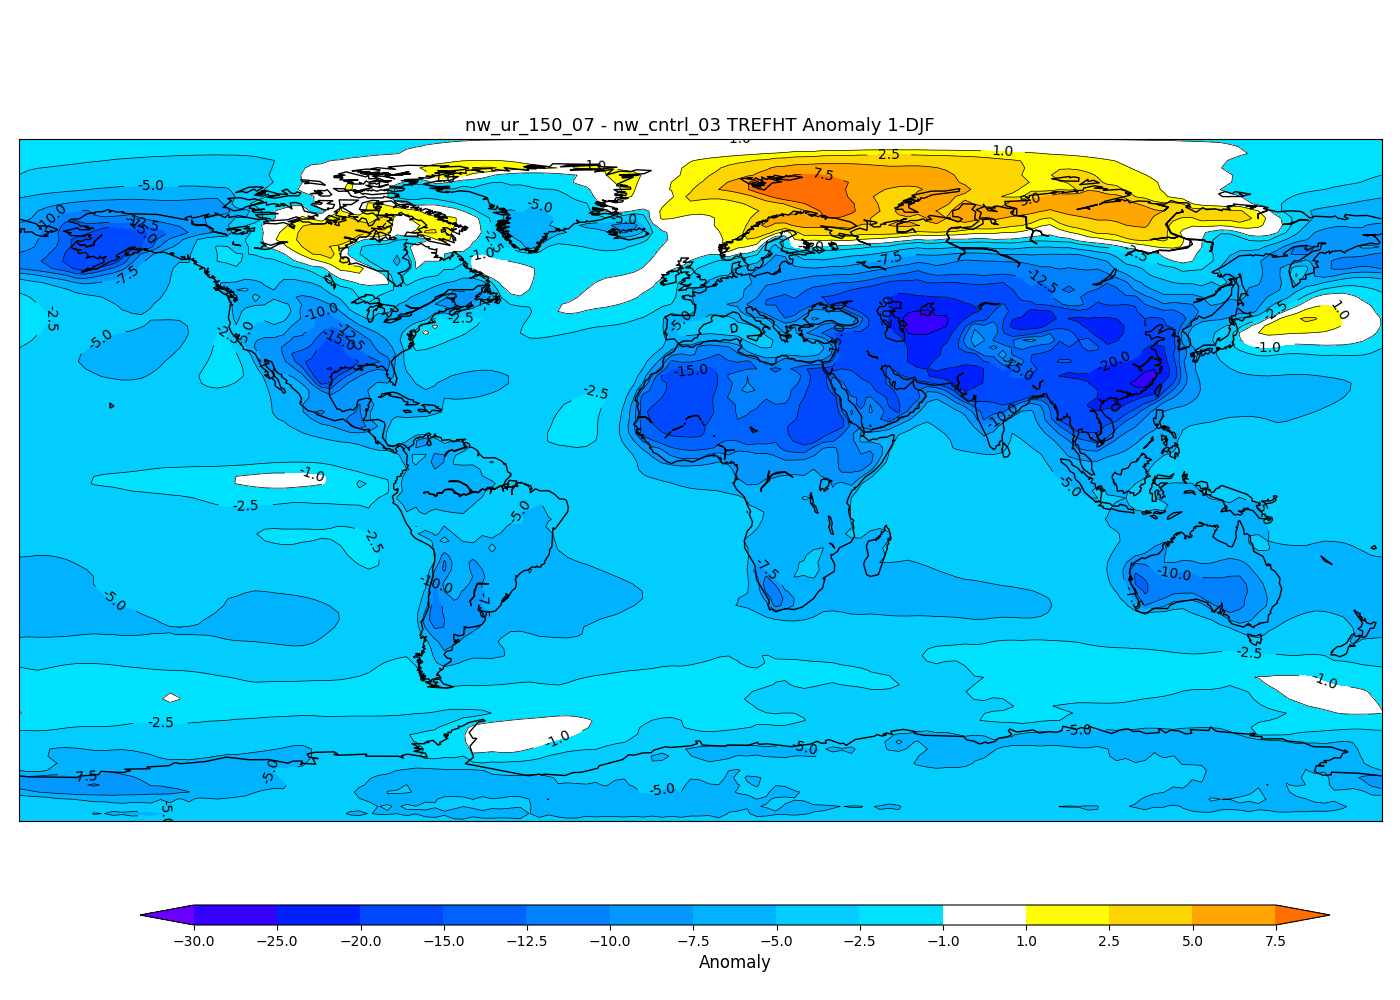
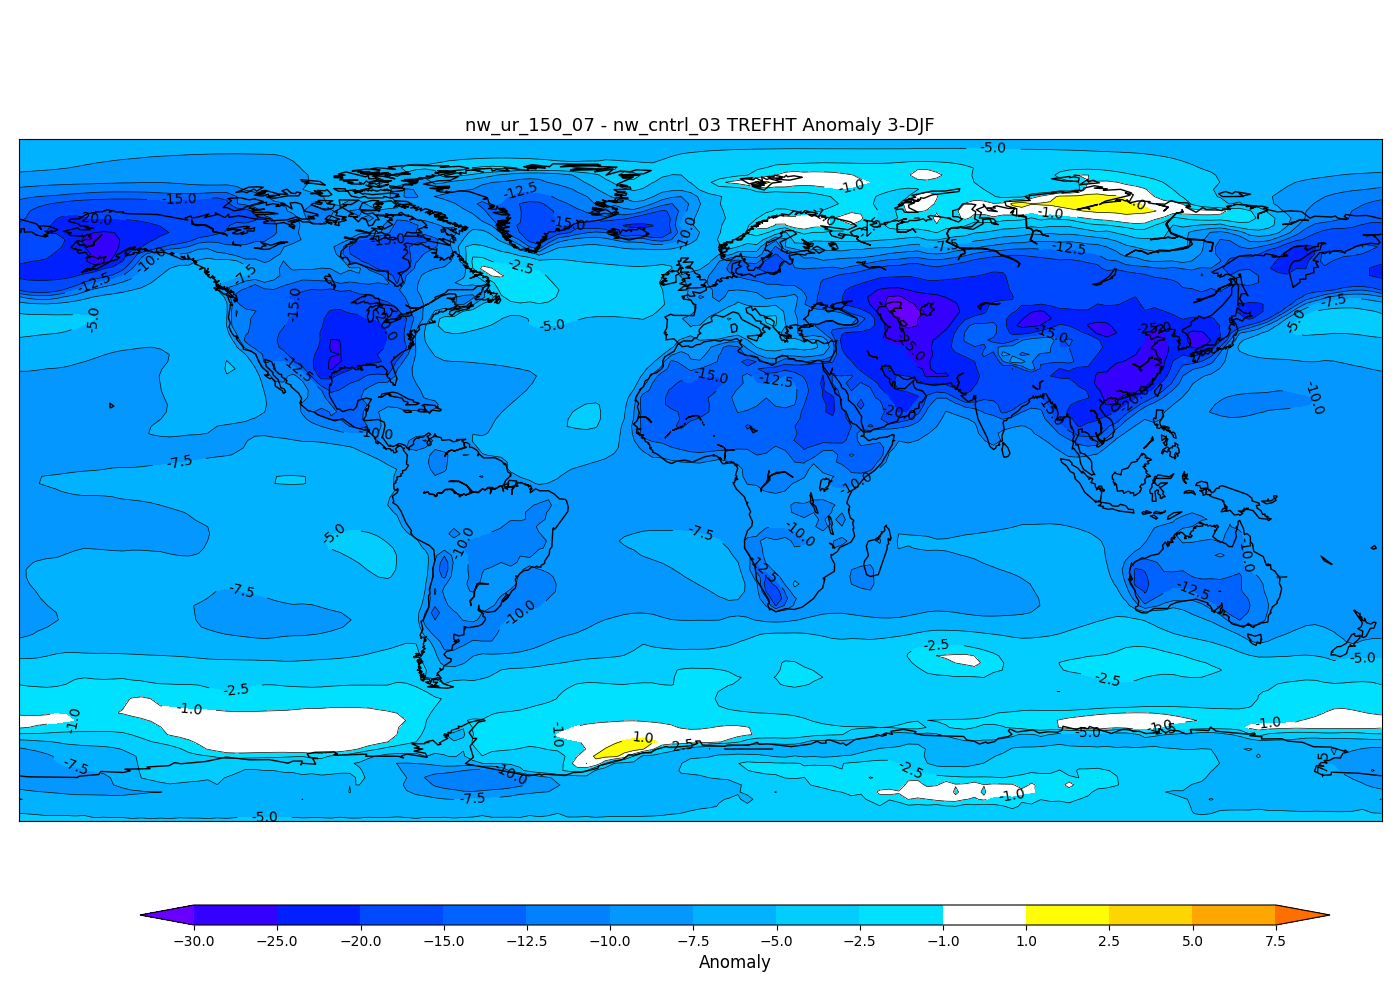
After checking both surface temperature and air temperature, they're very close. TS is <1C lower just north of Scandinavia, but using one over the other shouldn't affect my analysis too much. Here is a GIF of the first six DJFs of nw_150_07:
Plot DJF year 1
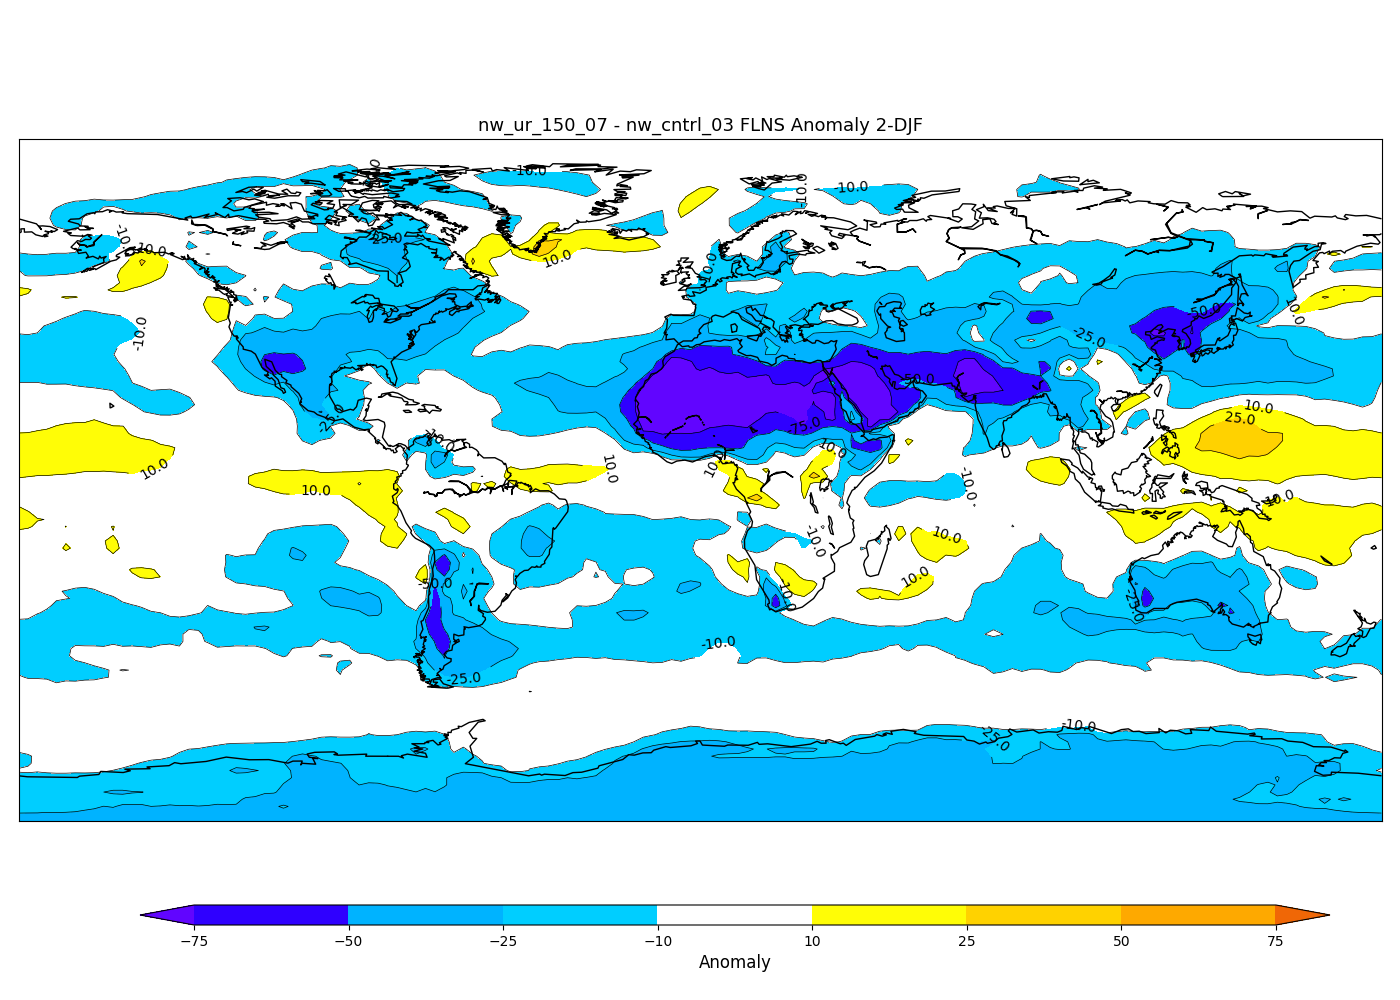
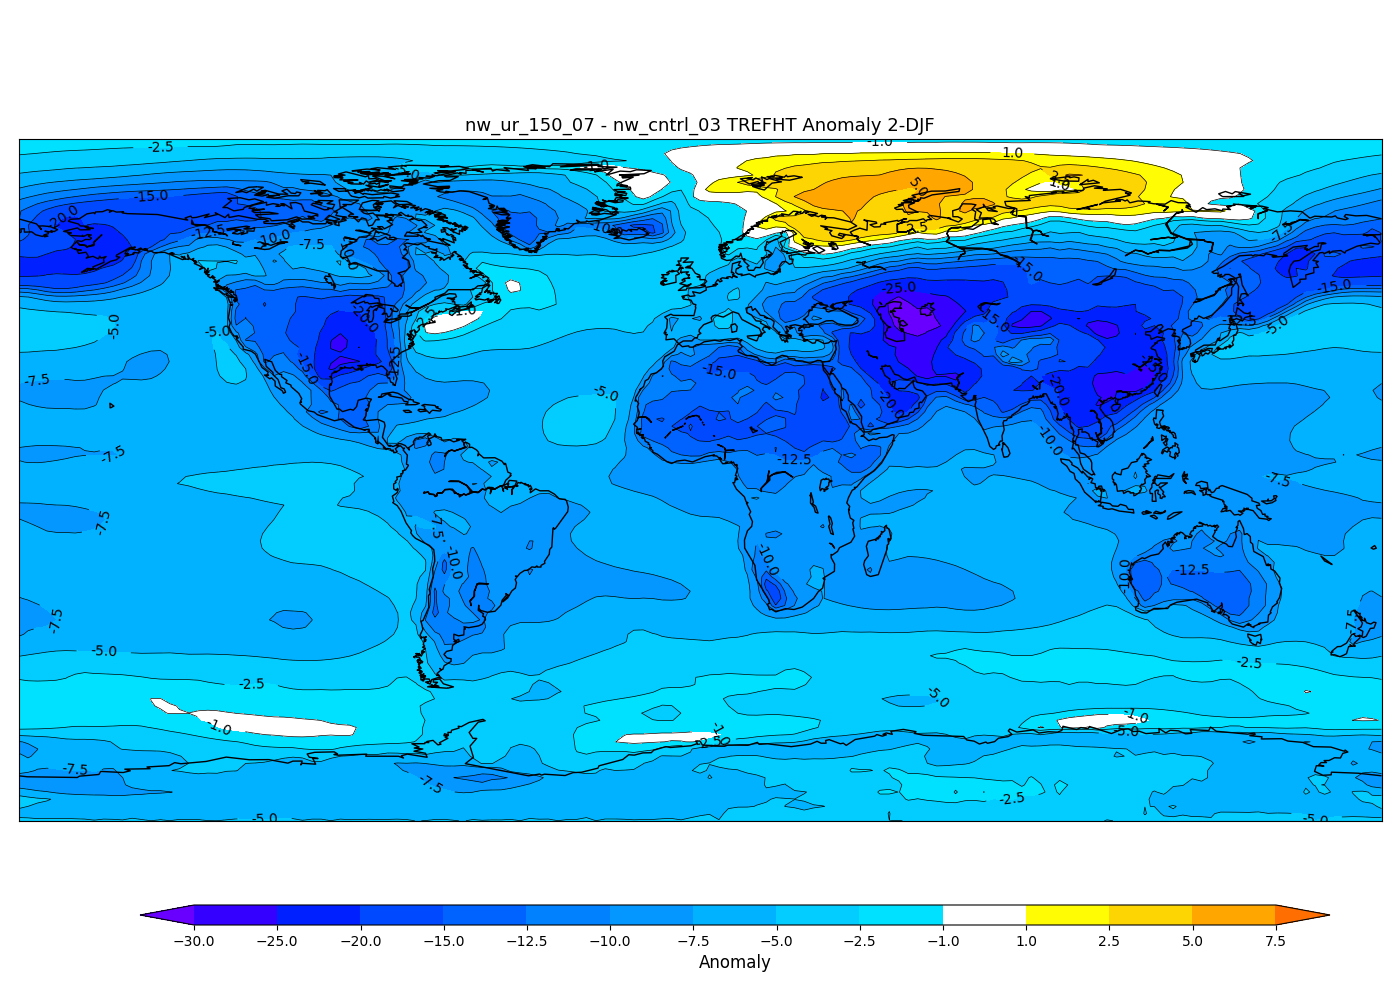
Plot DJF year 2
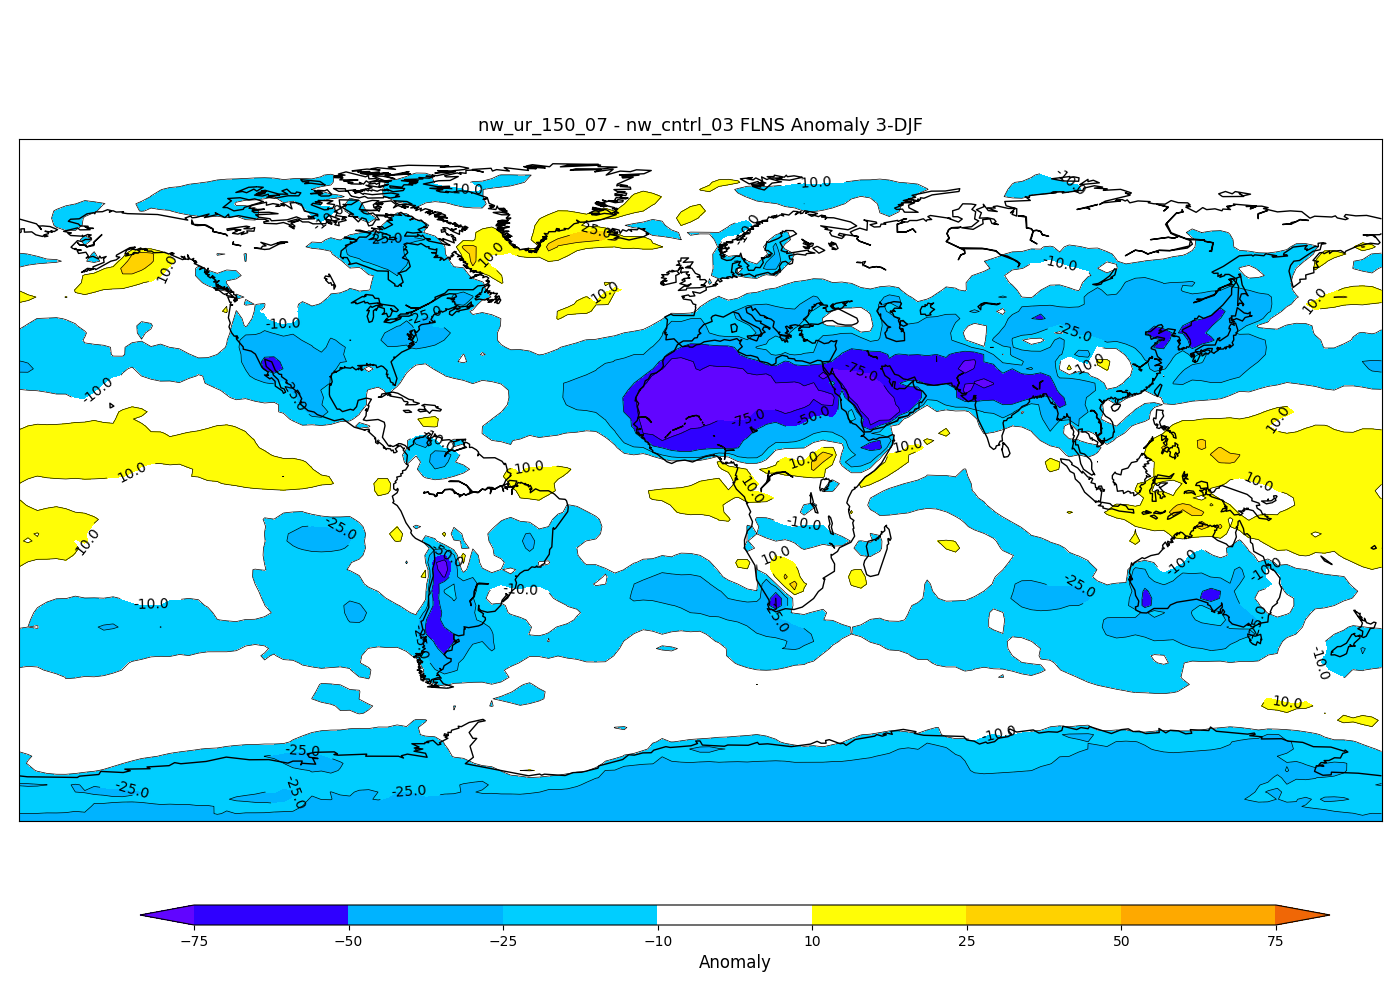
Plot DJF year 3
Plot DJF year 4
Plot DJF year 5
Plot DJF year 6
If you plot, as Chuck did, the change in net long wave, the change in short wave, the change in latent heat and the change in sensible heat then we can see which term has increased in the Arctic winter. It probably can't be short wave since I think your effect is above the Arctic circle. Possibly the air above the ground is warmer, so sensible heating goes up.Maybe evaporation of water has gone down so there is less latent heat lost. Anyway I bet net long wave went up, because longwave down went up. I think making a zonal average plot of these terms over the Earth for various seasons would be interesting.
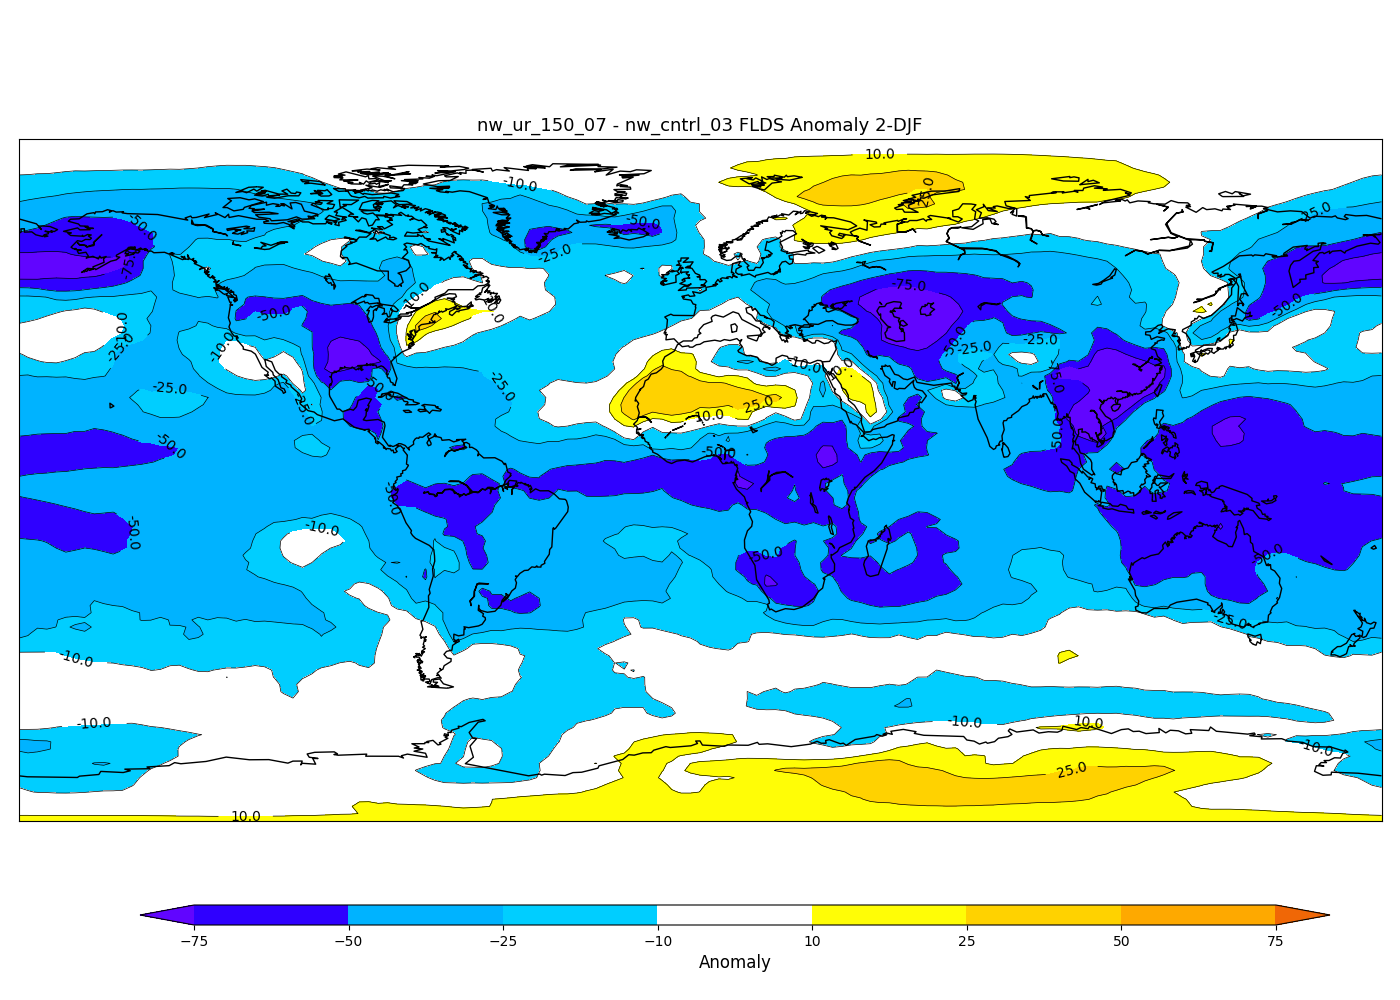
Here are 6 panel plots containing many of the variables you mentioned plus two more, for the first five winters. The strongest signal over the Arctic is the very positive downwelling longwave anomaly, but when you look at the net anomaly there is very little change, which would seem to indicate that the surface temperature of the Arctic is not changing much (which clearly is not the case).
Plot DJF year 1
Plot DJF year 2
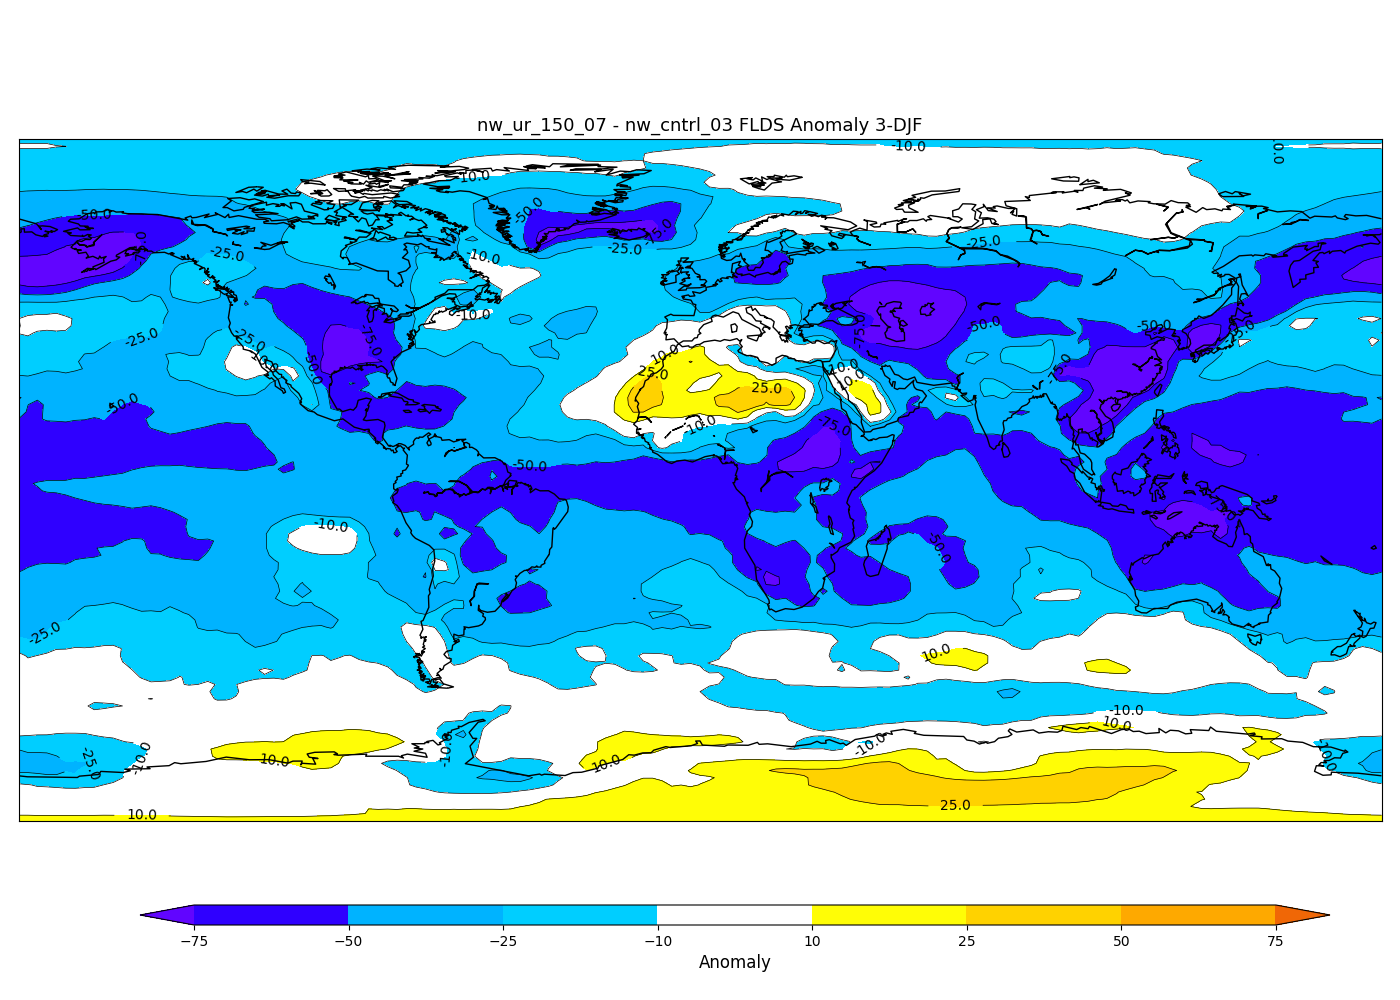
Plot DJF year 3
Plot DJF year 4
Plot DJF year 5
C. Let's suppose LW goes up. I can think of three reasons this might happen. 1. The stratosphere is full of water and at temperatures well above 300K. So it is radiating more LW downward. 2. Cloud cover has gone up and it is radiating downward and increasing LW down. 3. The lower atmosphere has warmed up (due to advection of warm air poleward) and it is radiating more LW, and transferring sensible heat down. Maybe your analysis sheds light on these terms.
D. I think looking at anomalies can be confusing. We need to start by looking at the temperature, cloud and wind fields in the control and 150 Tg cases. I think it is possible the lower atmosphere is isothermal and that is why clouds don't do an thing. It is also possible that there are few clouds so they don't do anything.
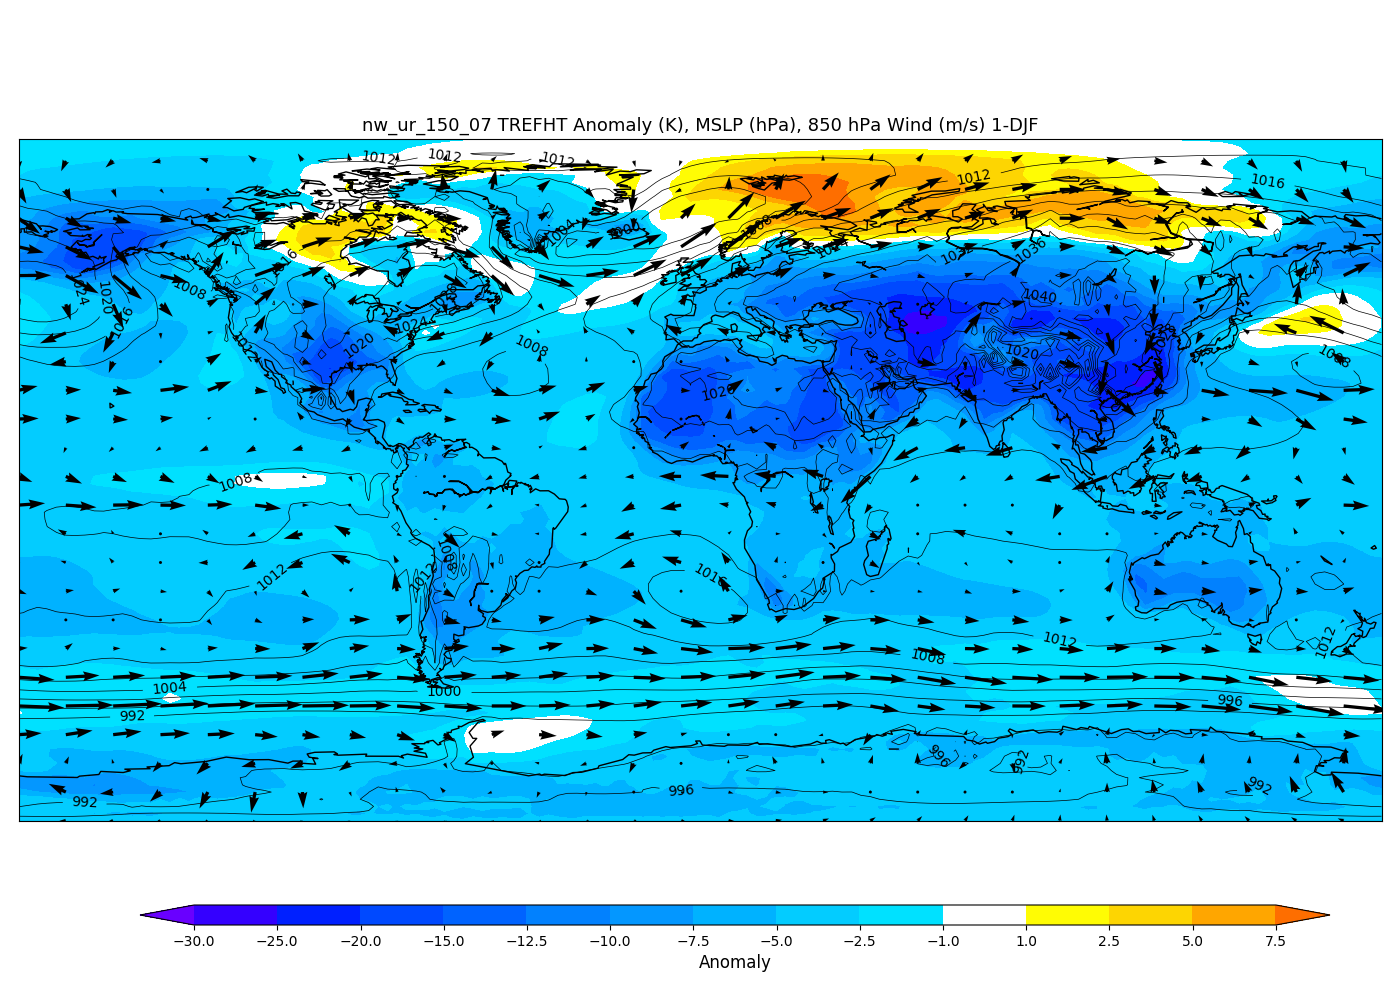
I believe temperature anomaly combined with winds really shows the impact of advection. The plot below is the 2m temperature anomaly, sea level pressure, and 850 hPa winds as arrows scaled to their value in meters per second.
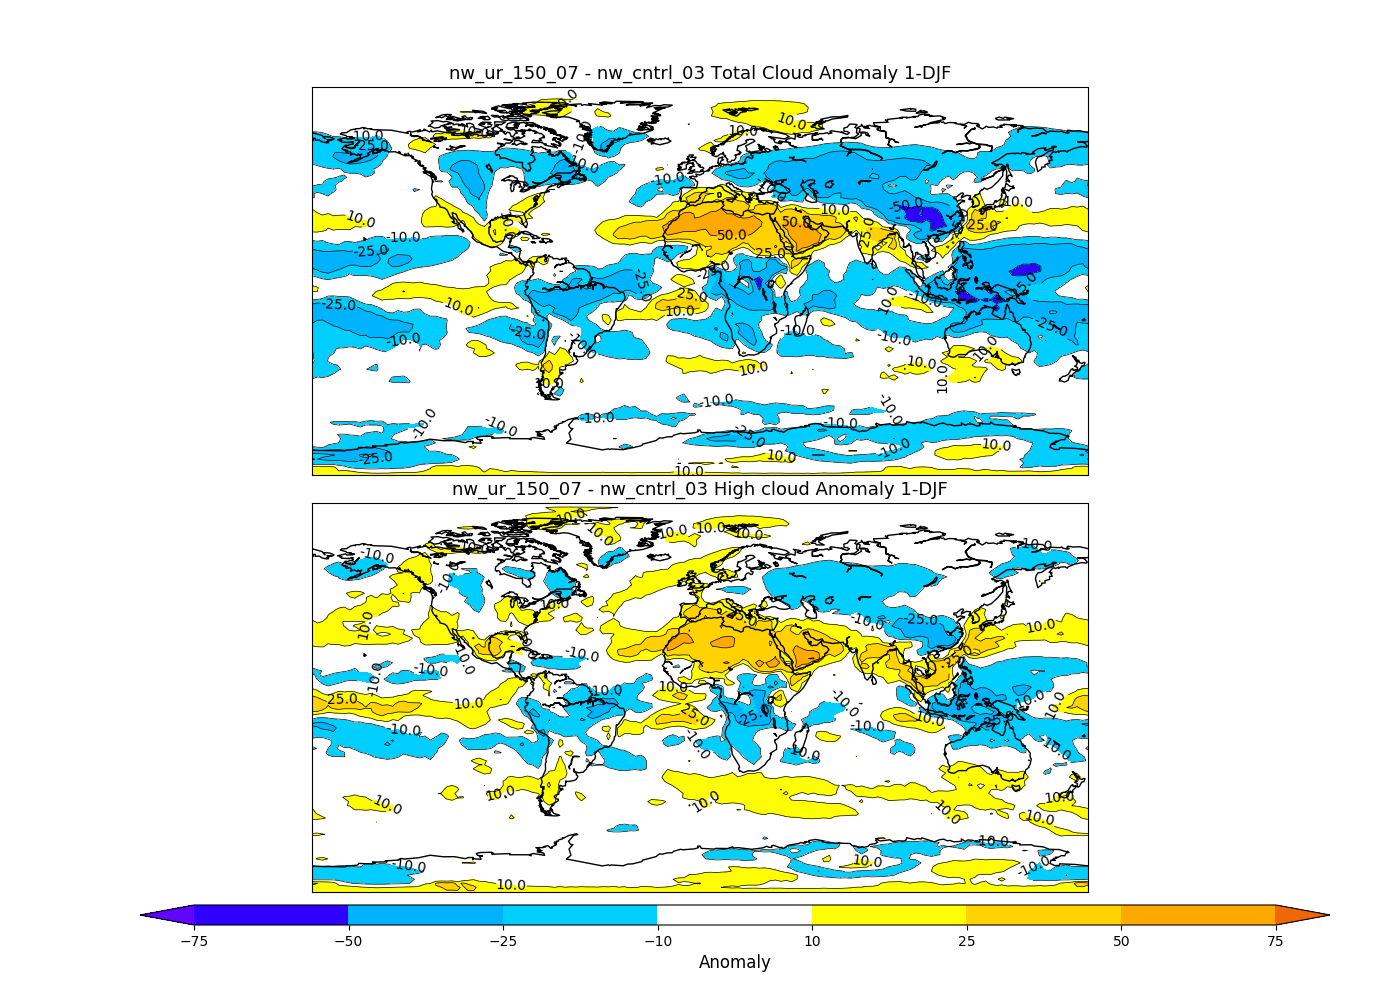
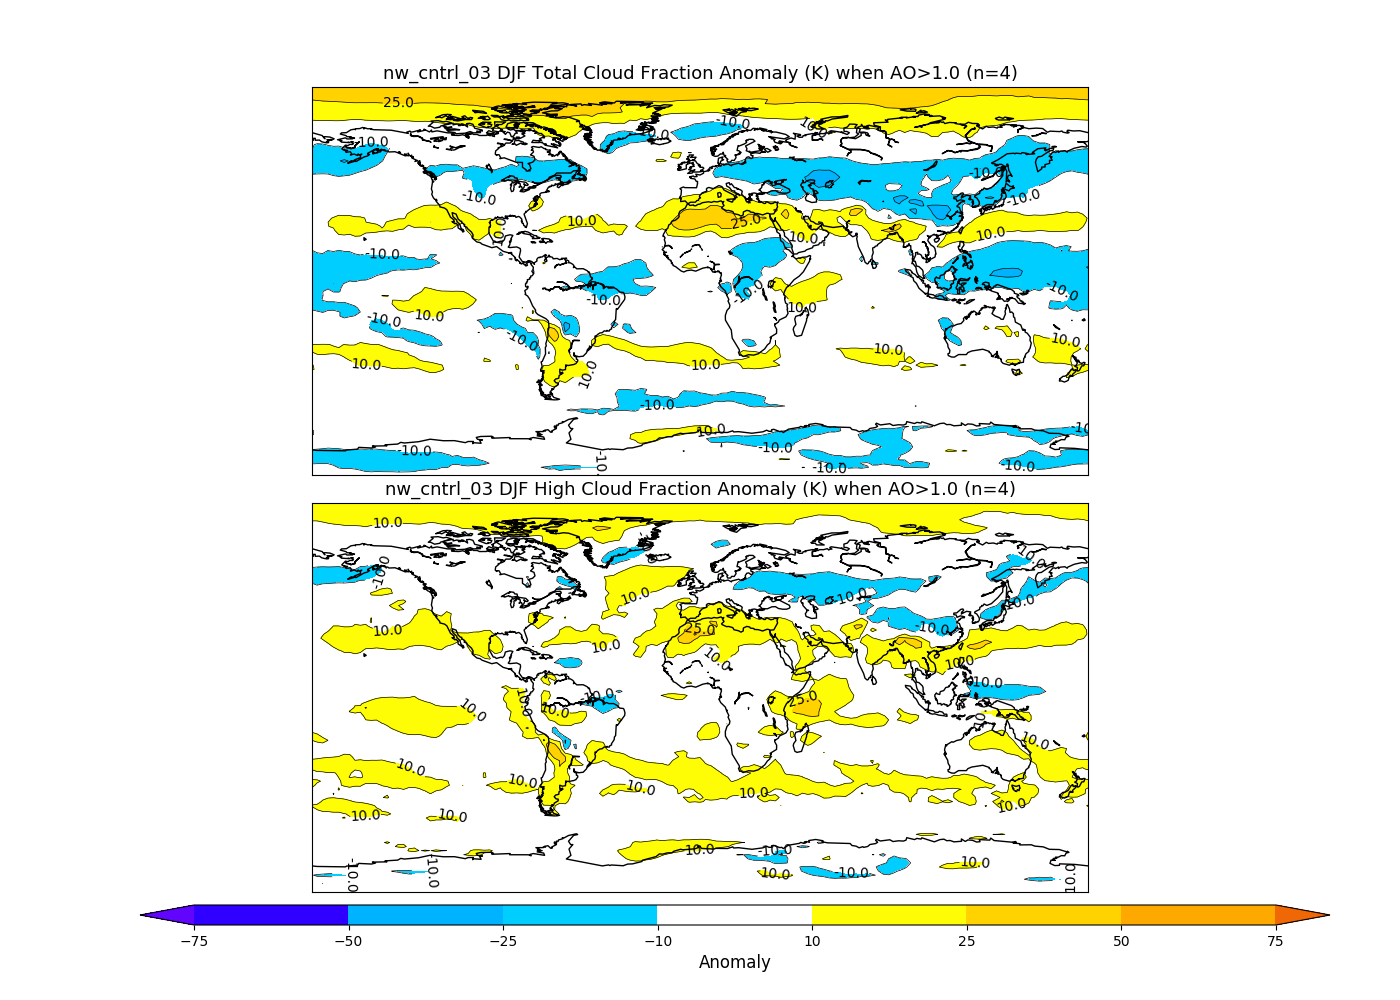
I started looking at cloud fields and it became immediately clear that clouds do contribute to the increased downwelling longwave radiation. Total cloud fraction anomaly has a +10% increase right over the warmest areas of the Arctic, mostly middle clouds and some high clouds. High clouds also increase over parts of the Arctic and along the path of warm air advection across the Atlantic.
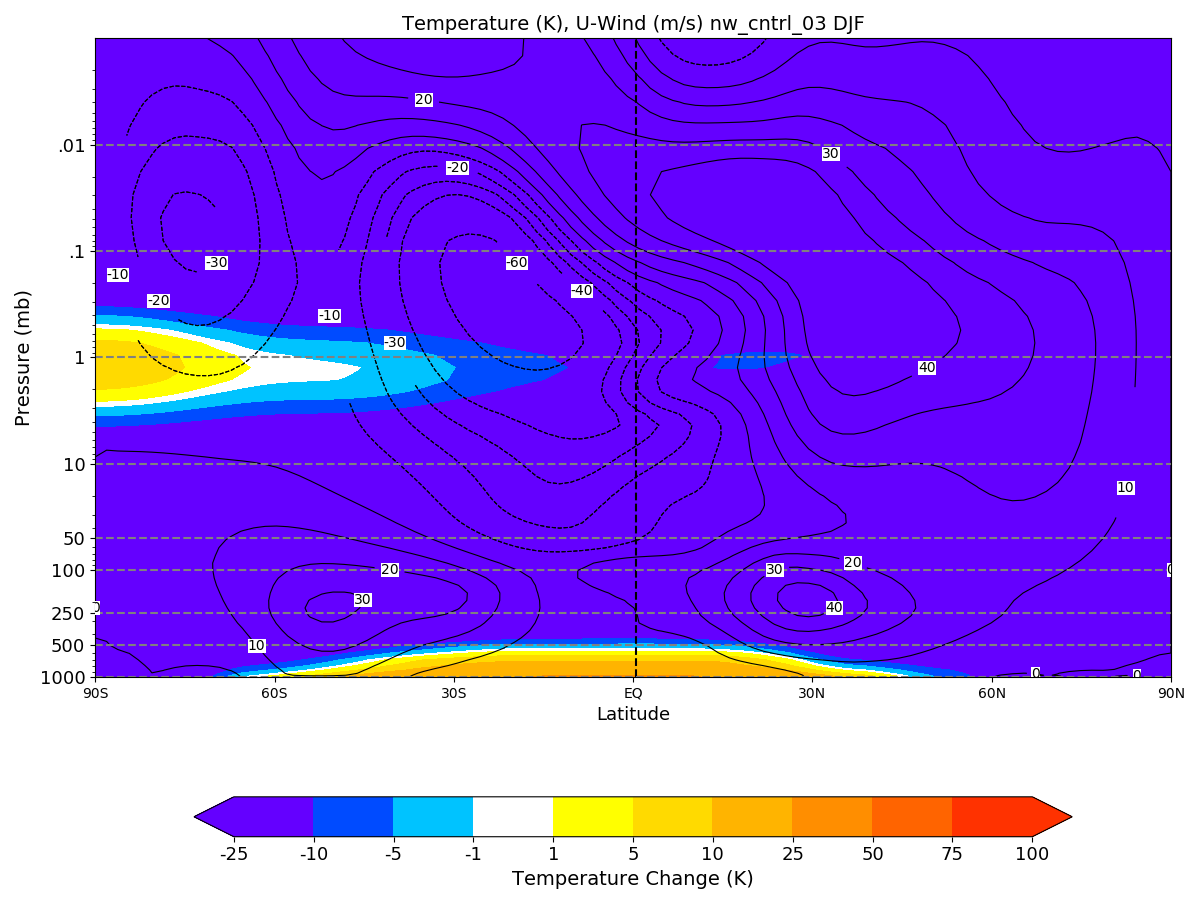
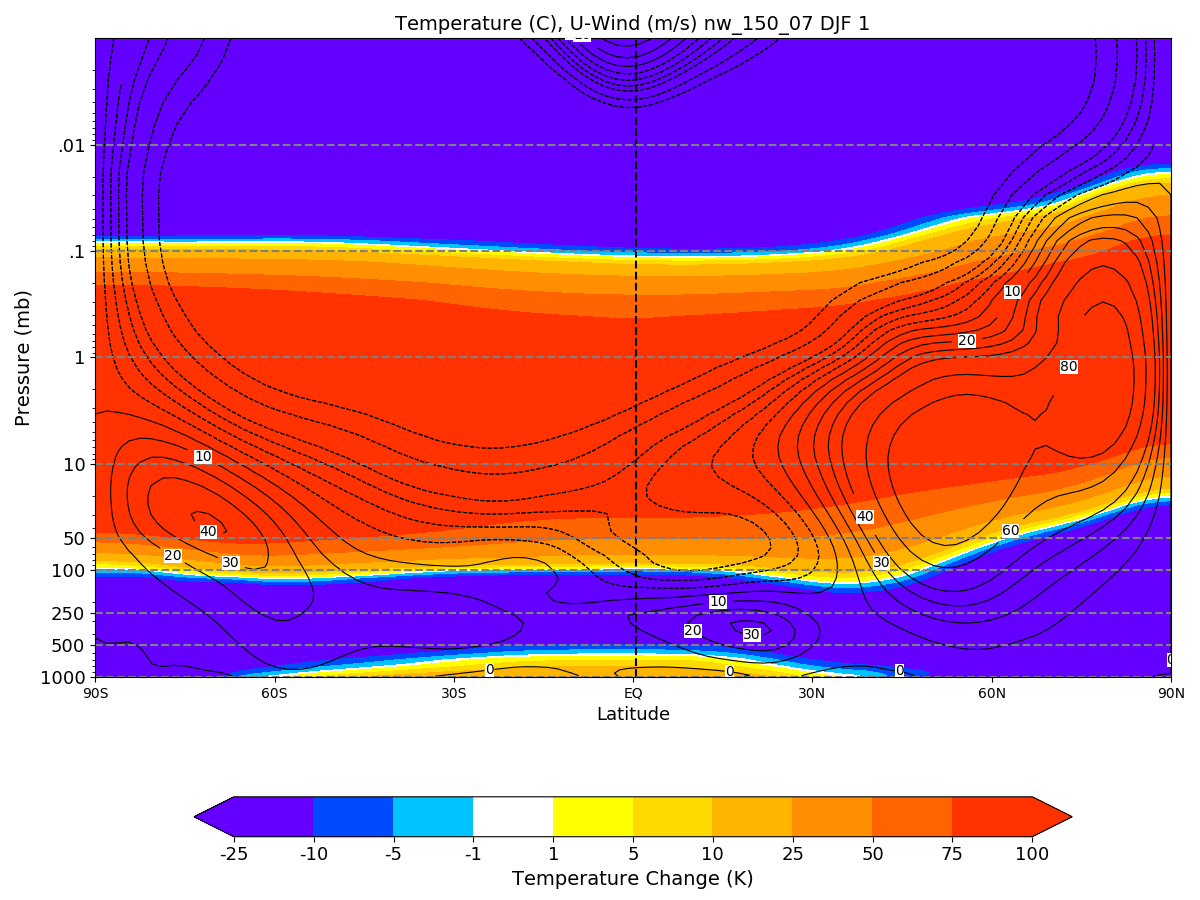
1. The temperature figure does show that the 50-100 mbar region did not warm as much as the pole, so the pole to eq. T gradient, which is no longer positive, did change sign and become large and negative there in the lower stratosphere. I guess this is because there is no SW soot heating in the arctic in the polar night and it is radiatively cooling. However, the tropospheric temperatures over the Arctic didn't change, while they cooled over the tropics. So in the troposphere the negative T gradient between tropics and pole became smaller.
It might be better to make one plot of T and winds in the normal atmosphere and one in the perturbed. I don't see a polar night jet in the troposphere, but looking at the anomalies is confusing. I don't see why the AO would care about the stratospheric temperatures. I am not that familiar with the AO. It is certainly positive however, in DJF.
In the previous cross-section plots I posted, it was only zonal plots, which didn't capture the significant meridional component to the wind. I think that is the reason why it doesn't seem like the troposphere has a response to the stratosphere. The AO is highly correlated to the stratospheric circulation. A very strong stratospheric polar vortex makes sudden stratospheric warming events highly unlikely - in fact, the frequency of SSWs drops by 100% in the years following a nuclear winter. Without any sudden stratospheric warming events to break up the polar vortex, it remains strong and at the pole. The stratospheric polar vortex can be weakened by poleward heat flux as well, but the stratospheric polar vortex following a 150 Tg is too strong to be split, elongated, or disrupted in any way. A strong stratospheric polar vortex influences the tropospheric AO because stratospheric vortex anomalies propagate down into the troposphere. The surface MSLP figures from my paper show his this is the case. Absolute temperature in celsius (ignore the colorbar label):
2. I don't really understand what this figure shows. I think it shows when AO is positive 1 you get Arctic warming. Does it show anything else? I assume the mechanism here is increased advection of warm air poleward when the AO is positive. Is that why the air is warmer? Are these plots of surface temperature?
I'm just trying to show how both control runs have a link between surface temperature and a +AO pattern, and then later on I show how similar it is to the surface temperature pattern following the 150 Tg injection of soot. Here are some plots showing 2m temperature anomaly and windspeeds
3. I think this shows a similar pattern of warm anomalies from a different control run and the 150 Tg case. These are similar.
During winters in the control with an AO > 1.0, you get an extremely similar surface temperature pattern as observed during the 150 Tg soot injection, due to the advection of warm air poleward. The plots are reference height temperature, or 2m temperature. Nearly identical to surface temperature.
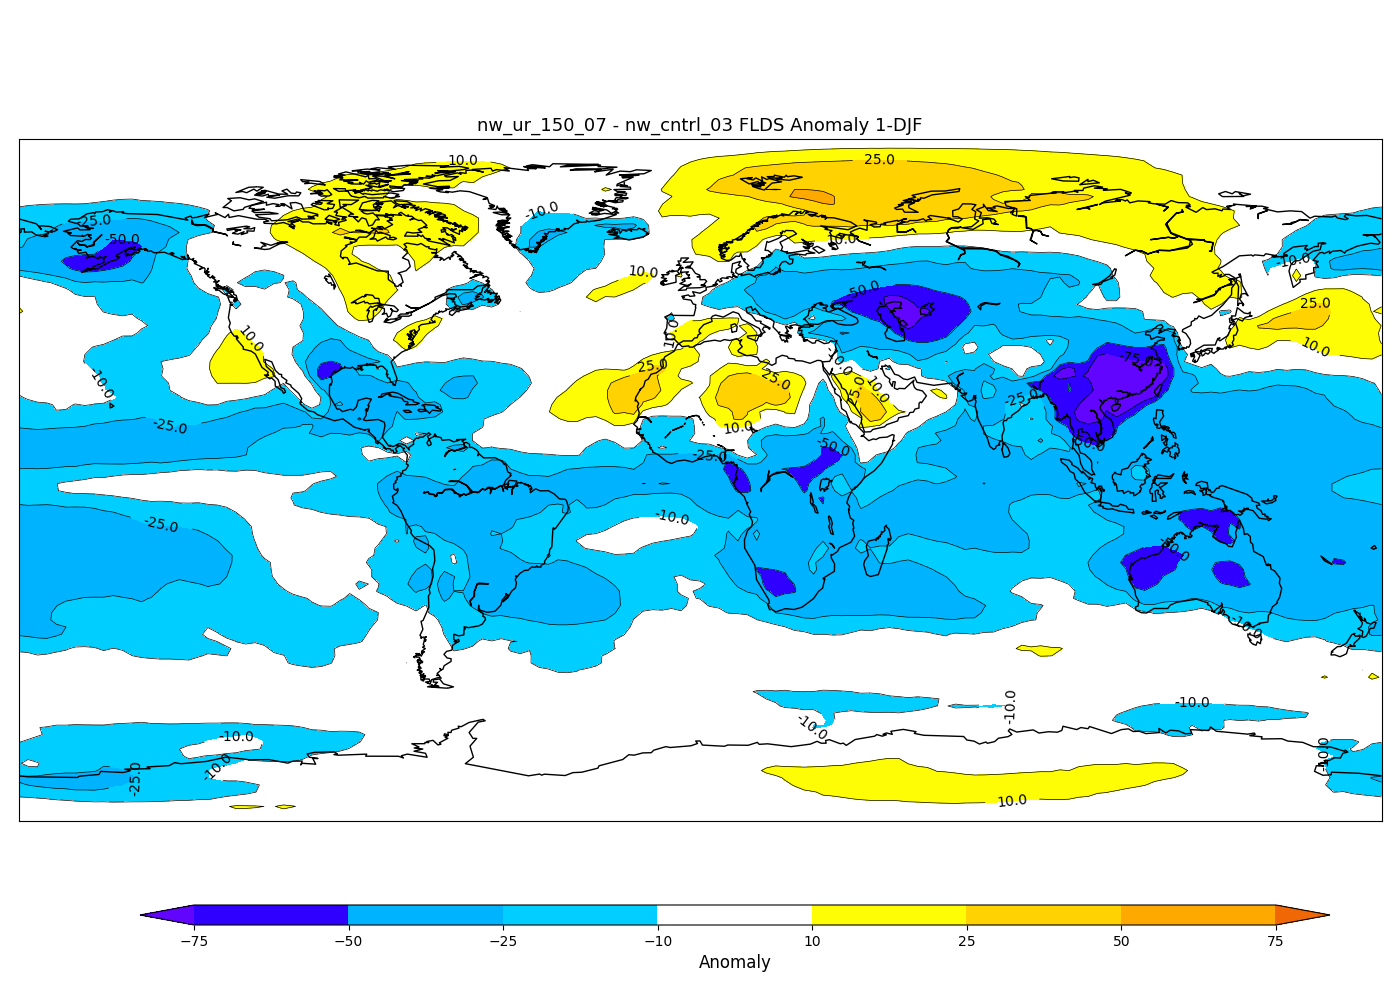
4. As I see it Fig. on left shows that at high AO either increased clouds, or increased lower air temperature or both lead to more LW down. This makes sense. The figure on the right shows LW down has gone up a lot, but we can't tell why. Your right hand figure in pt 1 shows no change in air temperature north of 60N. I bet clouds have gone down not up.-We need a plot of change in cloud for both cases, and a change in air temperature over the impacted regions to understand why LW down went up.
I believe that the latitude of the temperature response is a function of the strength of the AO, as the stronger AO usually indicates that the polar vortex is stronger and closer to the pole, which would shift the warm air advection poleward. However, the magnitude of warming that far north leads me to believe there is definitely something else at play.
Plotting clouds shows a slight increase in high/mid level cloud cover over parts of the north Atlantic and Arctic Ocean. Specifically, there is an increase in clouds over the same area that appears as a bullseye in the temperature anomaly plot.
5. I think we need to look at the temperatures in the atmosphere to understand the cloud forcing. If the temperatures have become nearly isothermal, it won't matter if you have clouds or not.
6. Your first point, right figure shows that the temperature in the arctic winter air didn't change, and neither did the winds below 500 mbar. This seems to contradict your conclusion. Maybe the zonal average is hiding things. I suspect there is no polar night jet as we know it in the troposphere. I am not really sure what the AO measures. When the atmosphere is perturbed this much it might be confusing to compute the AO. I think the eq. to pole T gradient has vanished in the troposphere and reversed in the lower stratosphere, but this is hard to see in anomaly maps.
FLDS: downwelling longwave flux at surface
A measure of the amount of radiation being radiated downward from the atmosphere. FLDS will be highly positive in the case of black carbon being heated up and re-radiating down back towards the surface. However, FLDS can be positive if the lower atmosphere is warmer than usual.
FLNS: net longwave flux at surface.
A measure of incoming IR - outgoing IR. During the first few winters, incoming IR and outgoing IR just about balance each other out at very high latitudes.