
Figure 1. Global mean reference height temperature anomaly during 6 nuclear war scenarios, where black carbon is injected into the 300-150 hPa atmospheric layer in CESM-WACCM. Anomalies are calculated with respect to a 21-year control run.
================================================================================
================================================================================
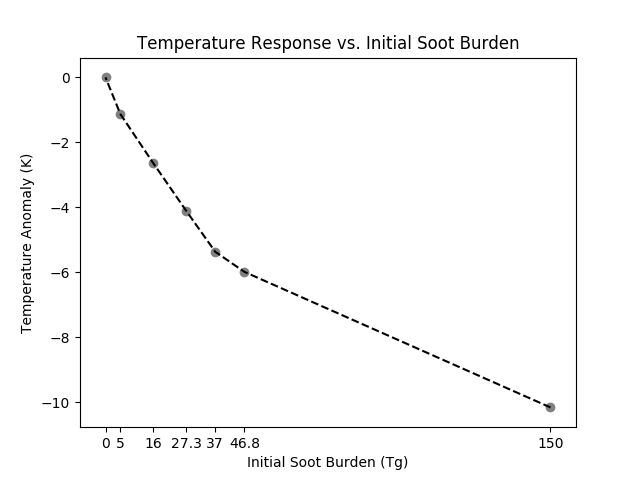
Figure 2. Most extreme global mean reference height anomaly during 6 nuclear war scenarios, where black carbon is injected into the 300-150 hPa atmospheric layer in CESM-WACCM. Anomalies are calculated with respect to a 21-year control run. Diminishing returns in observed temperature response are clear after the 37 Tg injection.
================================================================================
================================================================================
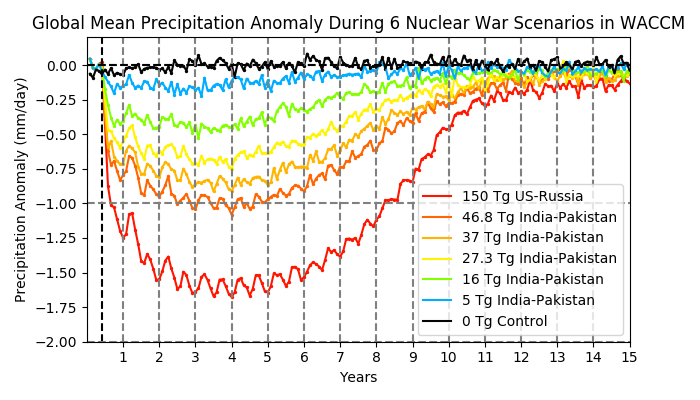
Figure 3. Global mean precipitation anomaly (mm/day) during 6 nuclear war scenarios, where black carbon is injected into the 300-150 hPa atmospheric layer in CESM-WACCM. Anomalies are calculated with respect to a 21-year control run.
================================================================================
SOI-based index: (pressure difference between Tahiti and Darwin)
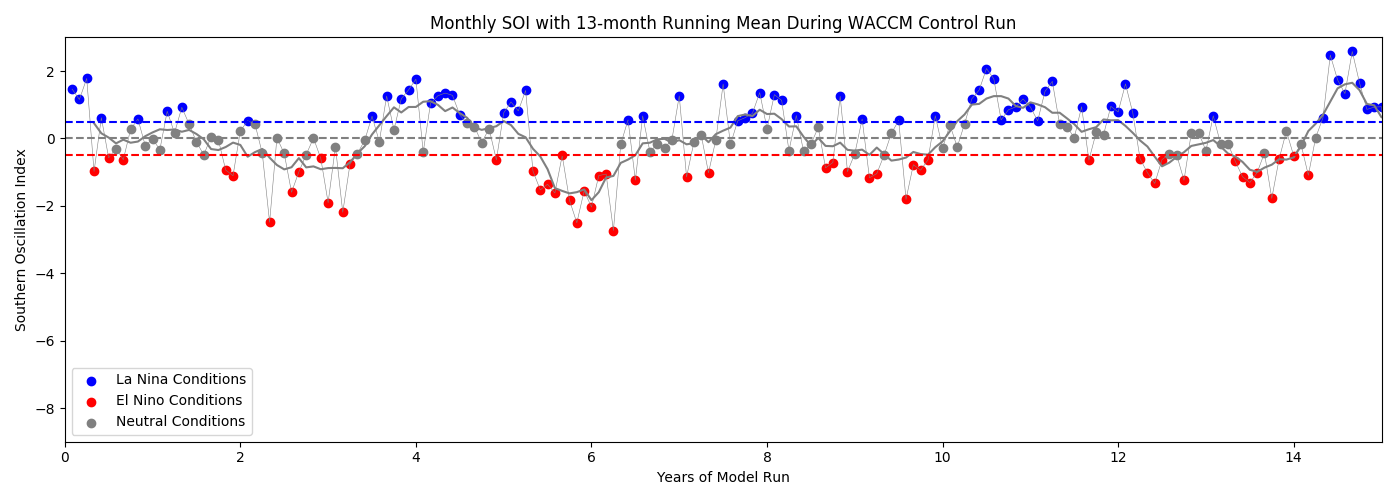
Based on the SOI index during the WACCM control run, El Ninos occur every 3 to 3.5 years, with the time between La Nina periods being anywhere between 2.7 and 4.3 years.
================================================================================
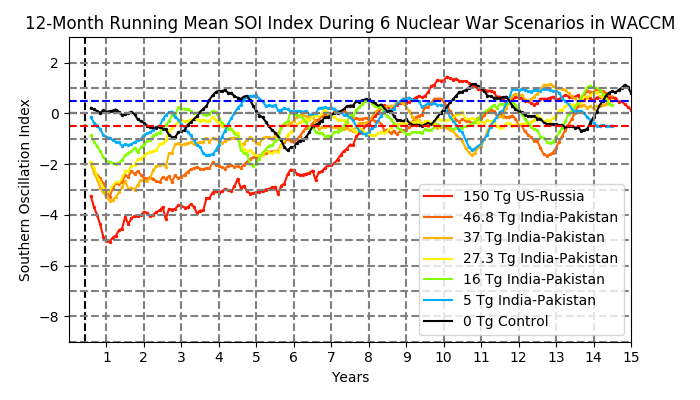
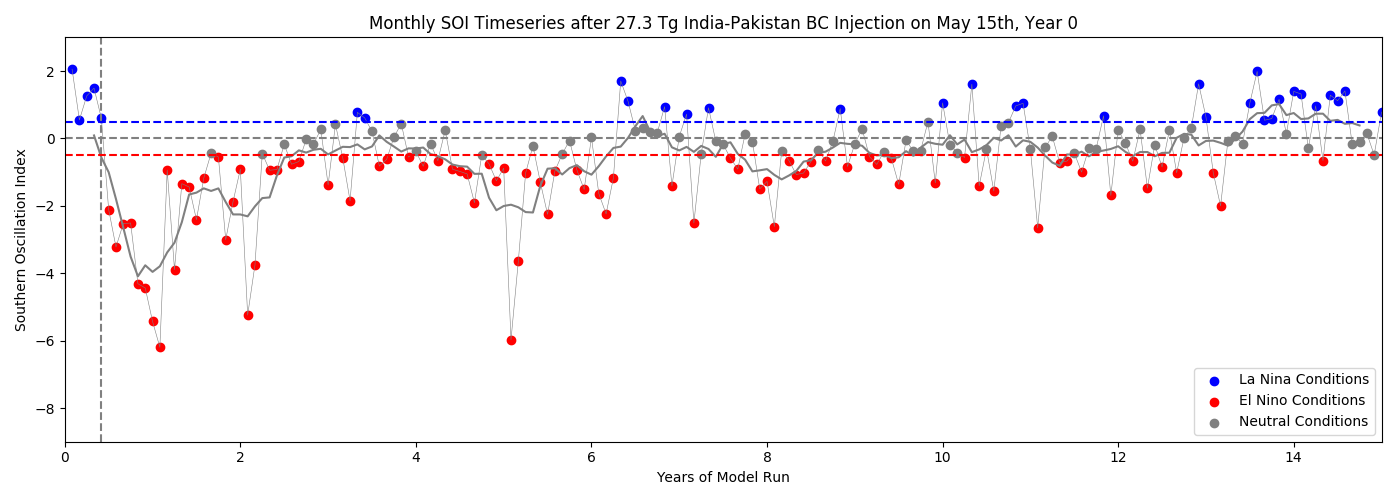
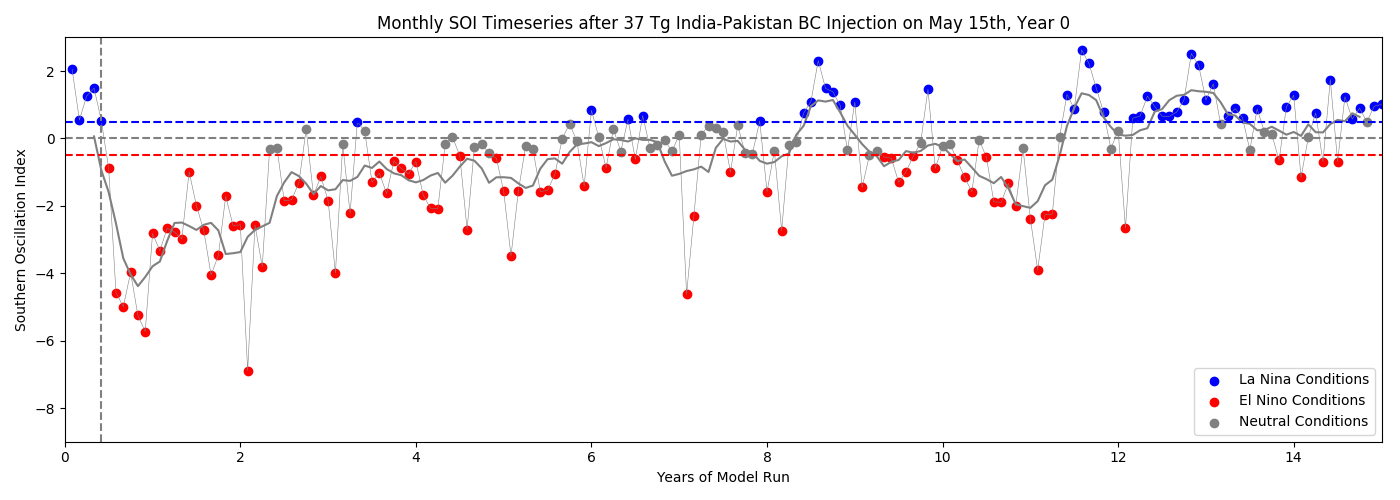
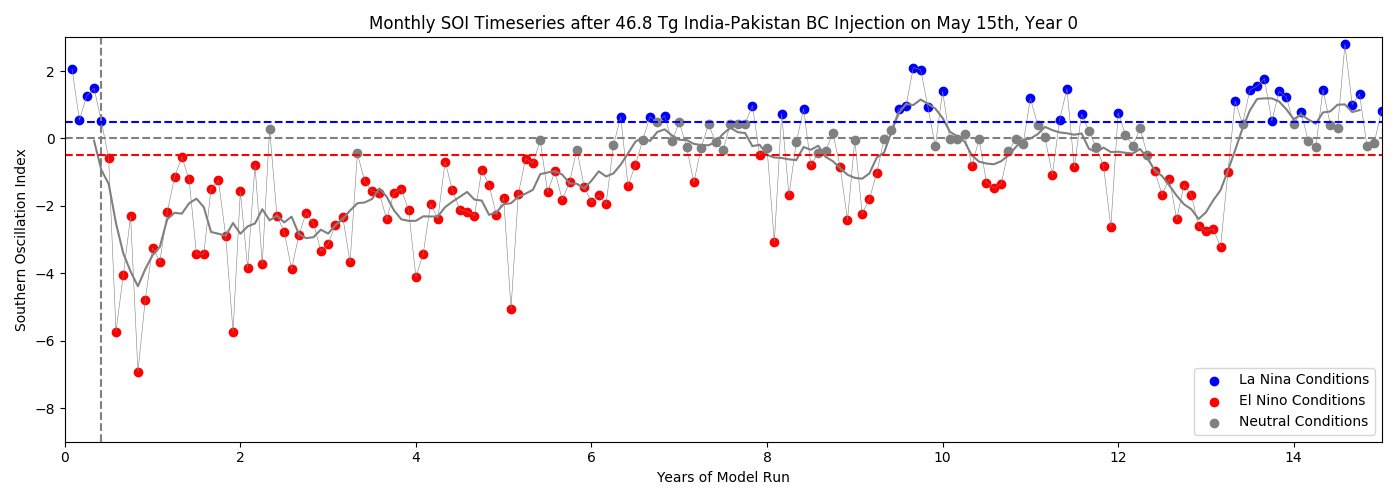
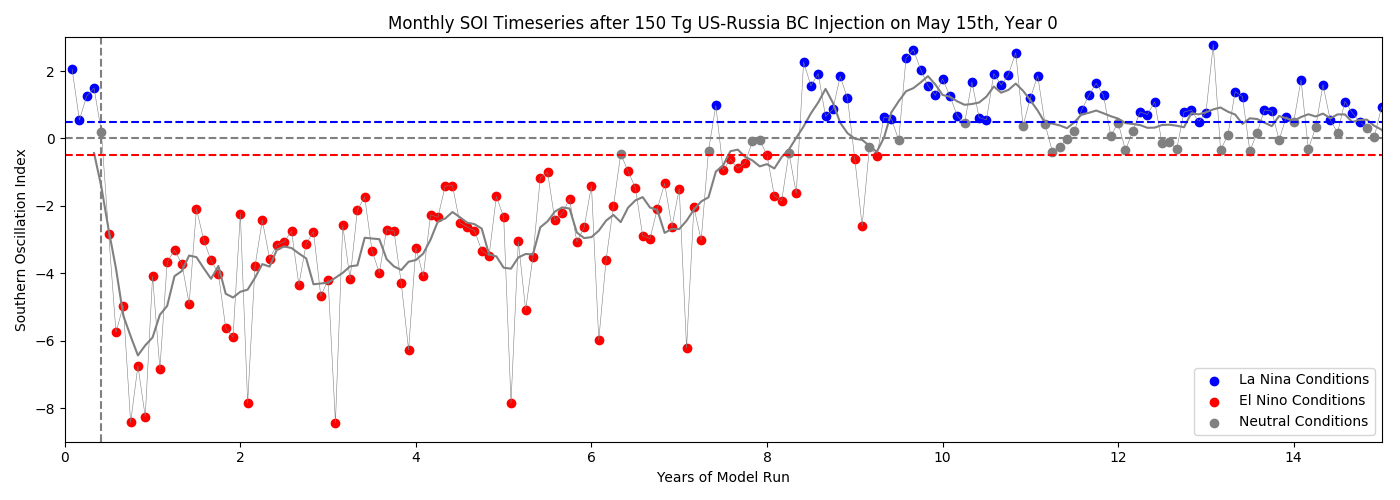
Figure 4. Southern Oscillation Index, a measure of the pressure difference between Tahiti and Darwin during 6 nuclear war scenarios, where black carbon is injected into the 300-150 hPa atmospheric layer in CESM-WACCM. Index uses a 21-year control run as the climatological conditions.
================================================================================
How does the ENSO response to a black carbon injection scale with the amount of black carbon injected into the atmosphere?
================================================================================
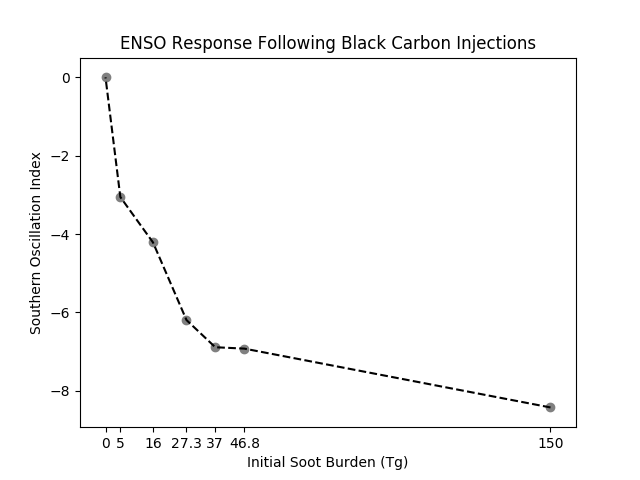
Figure 5. Minimum observed Southern Oscillation Index in the 24 months following 6 different nuclear war scenarios where black carbon is injected into the 300-150 hPa atmospheric layer in CESM-WACCM. , a measure of the pressure difference between Tahiti and Darwin during 6 nuclear war scenarios, where black carbon is injected into the 300-150 hPa atmospheric layer in CESM-WACCM. Index uses a 21-year control run as the climatological conditions.
================================================================================
================================================================================
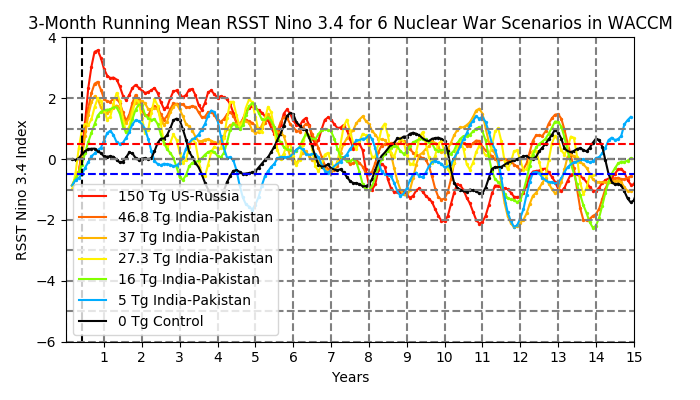
NINO 3.4 SSTs normalized by 20S-20N SSTA, following paper on African Kelvin waves being responsible for El Nino following volcanic eruption :
================================================================================
Link to 3-month averaged MSLP and 850 hPa wind anomalies during the first 20 months of each NW simulation:
3-month avg MSLP and 850 hPa wind anomalies
Link to 3-mo avg sfc temperature & 850 hPa wind anomalies during the first 20 months of each NW simulation:
3-month avg Sfc temp anomaly & 850 hPa wind anomalies
Link to SOI and equatorial Pacific surface temperature anomalies:
SOI and equatorial Pacific anomalies
================================================================================
================================================================================
================================================================================
================================================================================
Possible concerns with results: The beginning of each nuclear war scenario is May of Year 5 of the CONTROL RUN (nw_cntrl_03). This is obvious, as the first four months of each scenario has the exact same La Nina state. In the control run, a strong El Nino develops starting in May of Year 5. The injection of black carbon occurs on May 15th and is simultaneous with the development of a very strong El Nino in each nuclear war run. It may be necessary to re-run some of the nuclear war scenarios during a period not pre-conditioned to develop a strong El Nino. For example, May of Year 14 in the control run was progressing towards a strong La Nina state. If we ran these nuclear war scenarios from May of Year 14 in the control and the amplitude of the El Nino in the following year was less strong, this would show that the type of atmospheric state on May of Year 5 had an influence on the ENSO response following a black carbon injection.
Reasons not to be concerned: The black carbon injection causes an EXTREMELY strong westerly wind burst, providing an enormous forcing for the development of an El Nino (at least with BC injections greater than 5 Tg).
================================================================================
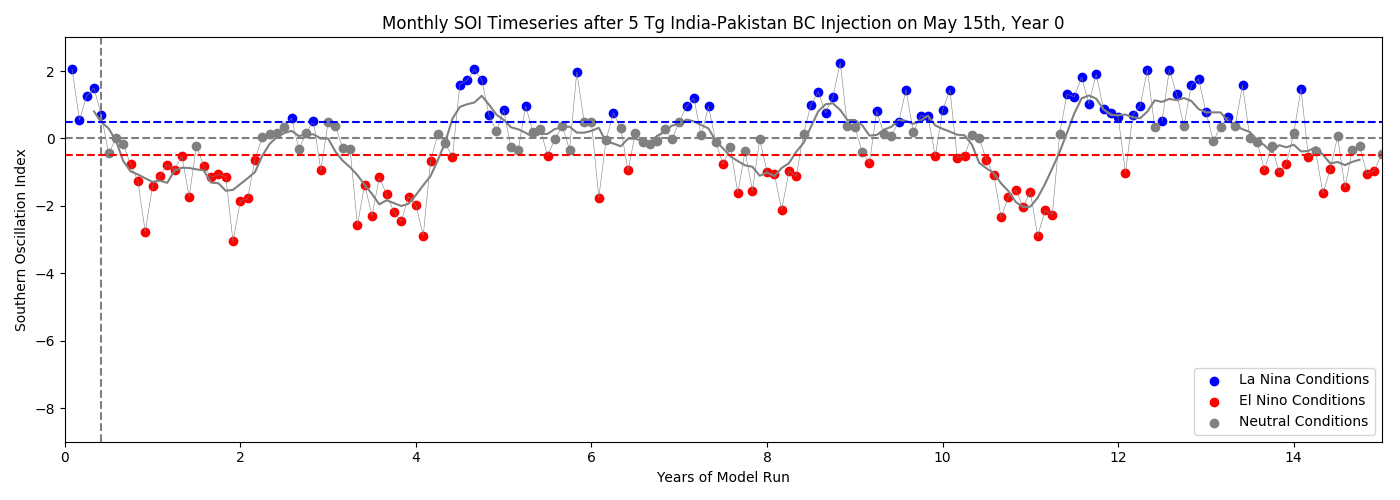
nw_targets_01 = 5 Tg India-Pakistan case: A strong El Nino develops within 6 months of a 5 Tg soot injection, but the amplitude of the El Nino is well within the bounds of a typical El Nino event as observed during the control run. The El Nino remains strong for a longer time than is observed during the control run but by the spring of Year 2, La Nina conditions appear. Another strong El Nino begins in the February of Year 3, after a year-long period with neutral to weak La Nina conditions. The strong El Nino lasts from February of Year 3 to May of Year 4, when a strong La Nina develops. From May, Year 4 through May, Year 7 there is a tendency for neutral to La Nina conditions. Things become more regular and cyclical after this time, as the cooling of the earth is fully realized in the oceans.
==============================================
nw_targets_01 = 5 Tg India-Pakistan case
nw_targets_02 = 27.3 Tg India-Pakistan case
nw_targets_03 = 37 Tg India-Pakistan case
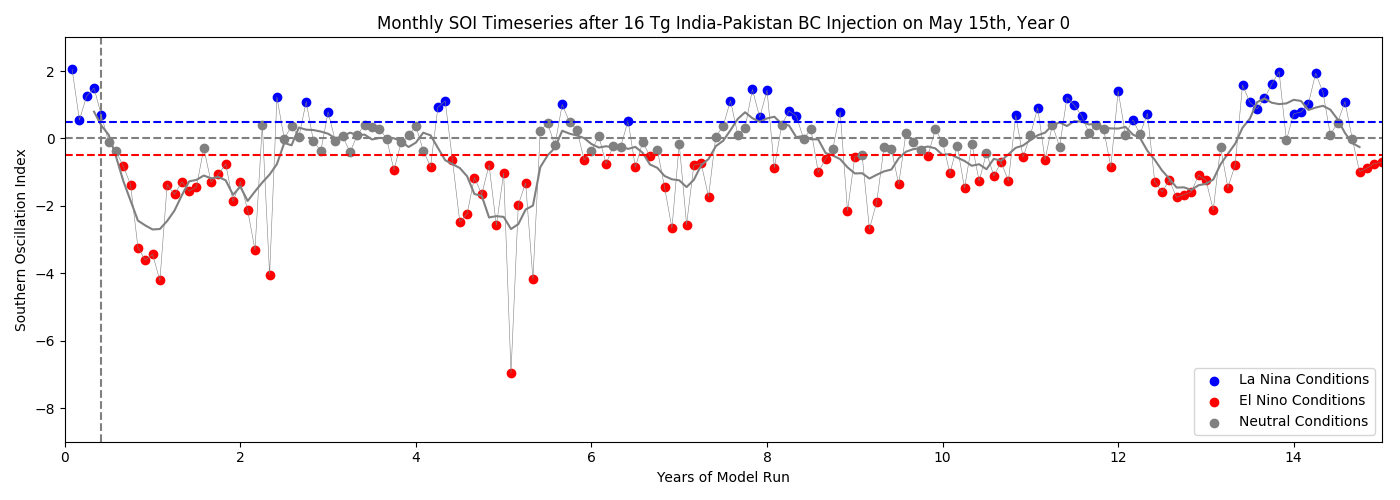
nw_targets_04 = 16 Tg India-Pakistan case
nw_targets_05 = 46.8 Tg India-Pakistan case
nw_ur_150_07 = 150 Tg US-Russia case
nw_cntrl_03 = 0 Tg, control case