Examining
ENSO Statistics in CESM-LE
An
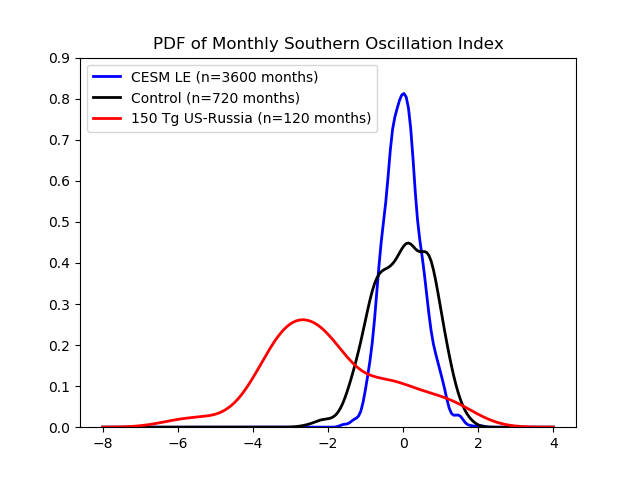
analysis of the probability density function (PDF) of the Southern
Oscillation Index (SOI) in the CESM-WACCM4 control run, 150 Tg
US-Russia nuclear war scenario, and CESM-LE 1850 PI run highlights a
potential issue with our 60-year (720 month) control run compared to
the CESM-LENS PI run. The PDF of the SOI in the CESM-LENS PI run (200
year sample) is far more narrow compared to the 60 years of the
CESM-WACCM4 control run. The 150 Tg US-Russia run is skewed to the
left as a result of the Nuclear Niño.
I
examined 10 random 720 month chunks of the CESM-LE to test whether
using sample sizes similar to the 60-year CESM-WACCM4 control run
could explain the difference between the CESM-LENS PI and CESM-WACCM4
control run. Unfortunately, this is not really the case. There are
minor variations to the left and right but no single chunk is as wide
as the CESM-WACCM4.
Potential
explanations for differences:
1.
CESM-WACCM4 uses year 2000 CO2 concentrations. It’s possible that
in a warmer climate, CESM simulates a higher amplitude ENSO signal.
2.
CESM-WACCM4 uses a high-top model for its atmospheric component
compared to CESM-LE which uses CAM5. The higher-top model better
simulates stratospheric dynamics which could influence ENSO.
Next
step: I could use the 35 ensembles available with the CESM-LE and use
the 1990-2005 period (15 years * 35 ensembles) for 525 years to see
if it resembles the CESM-WACCM4 more.
OR I can figure out
if anyone has used WACCM4 to run a longer control run which I could
use as comparison.
OR I
could do nothing and just word any comparisons of Nuclear Niño to
the historical record more carefully.