Lag
Correlation: RSSTA Warming In Response to Maritime Continent
Cooling
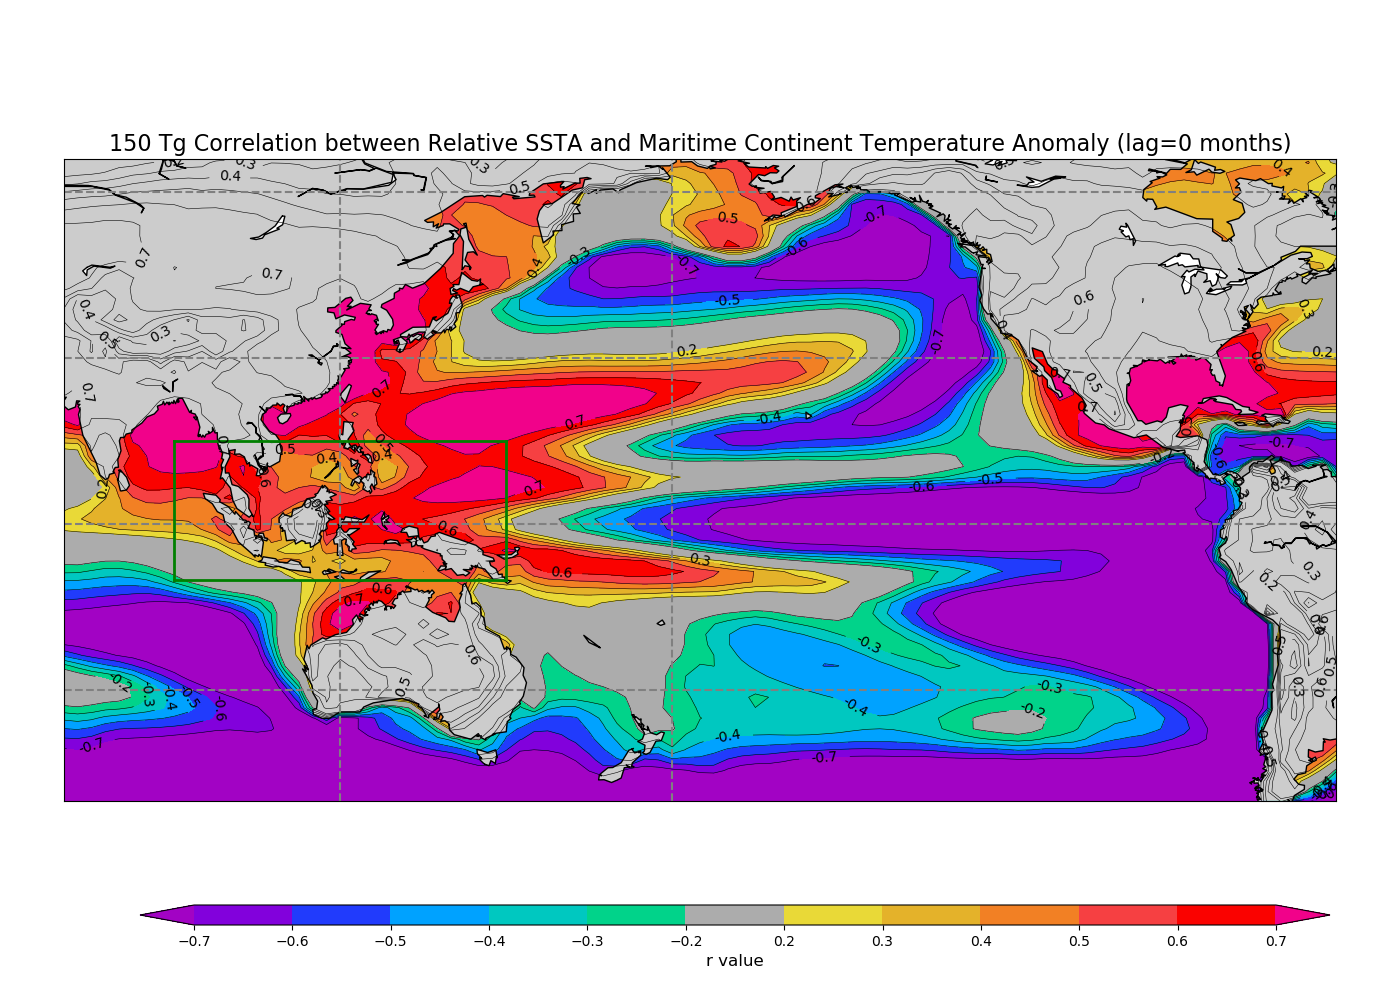
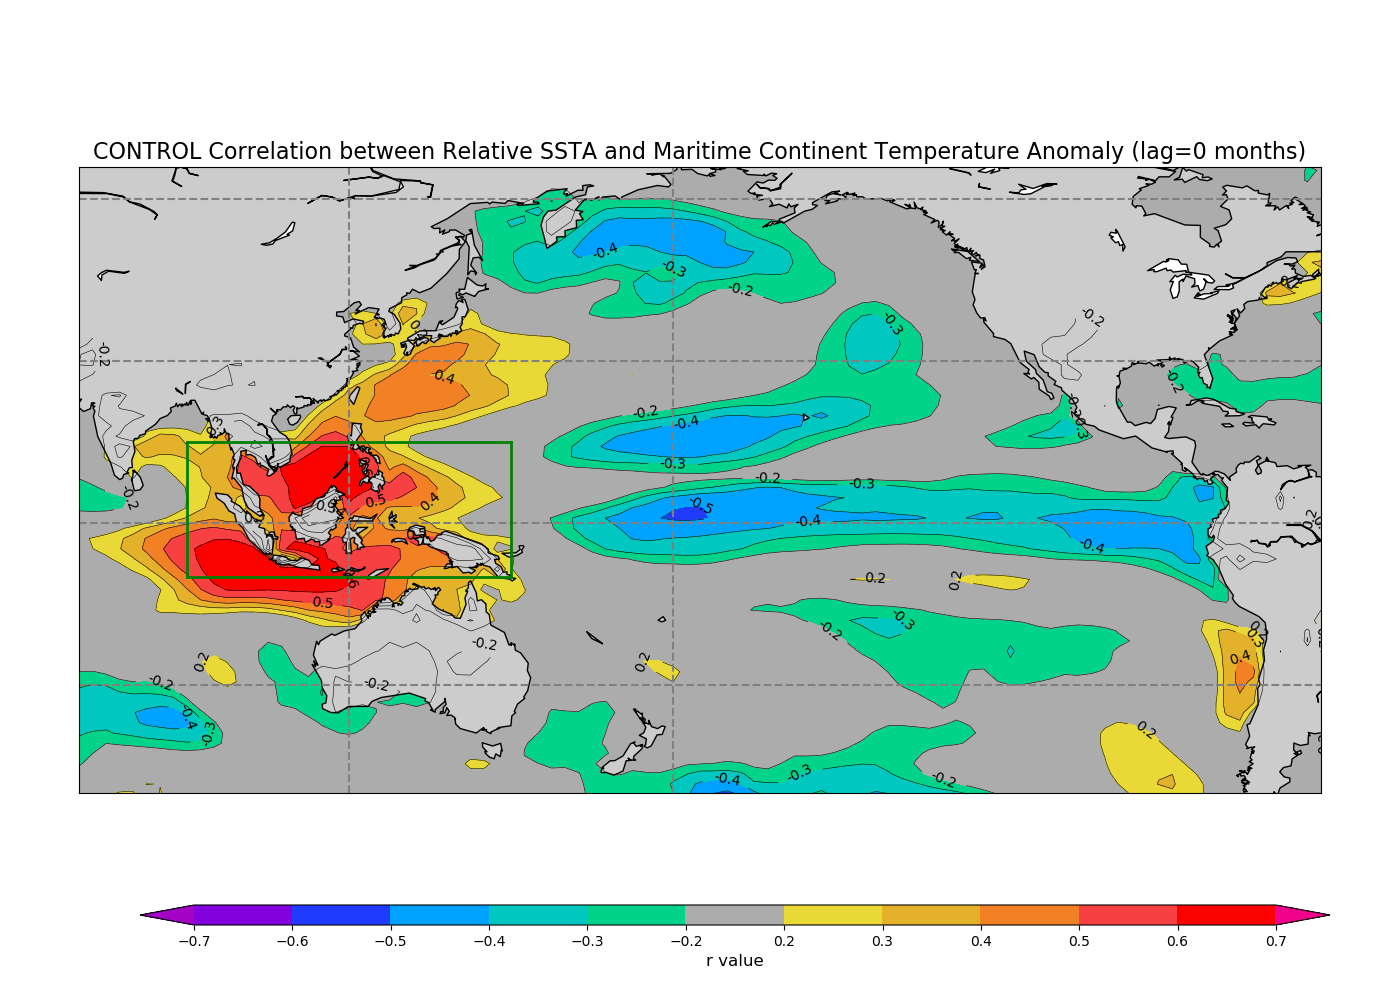
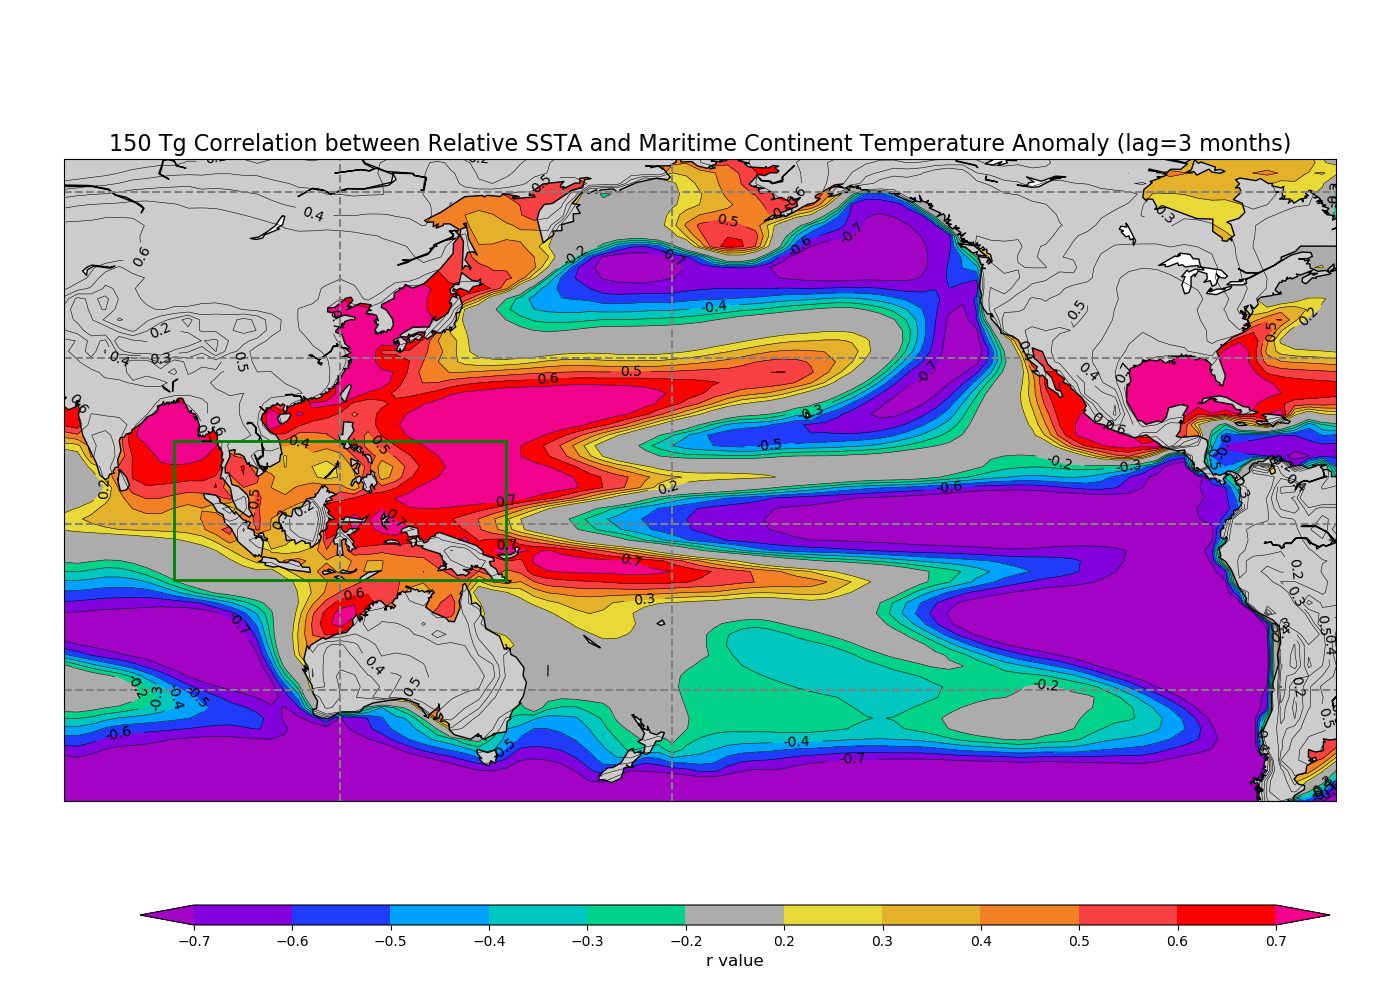
Below are a
series of plots of the correlation coefficient between Relative Sea
Surface Temperature Anomalies (RSSTA)* at each gridpoint and Maritime
Continent surface temperature anomalies (10S-10N, 90E-150E, green box
in plot) at a number of different lags during the 10-years of the 150
Tg US-Russia nuclear war simulation. The lag represents the lag of
the RSSTA response to the Maritime Continent surface temperature
anomalies.
*RSSTAs are calculated by subtracting the mean
tropical SSTAs (20S-20N) in all locations. Code in
NuclearNino/19Coupe/Response2Review.py
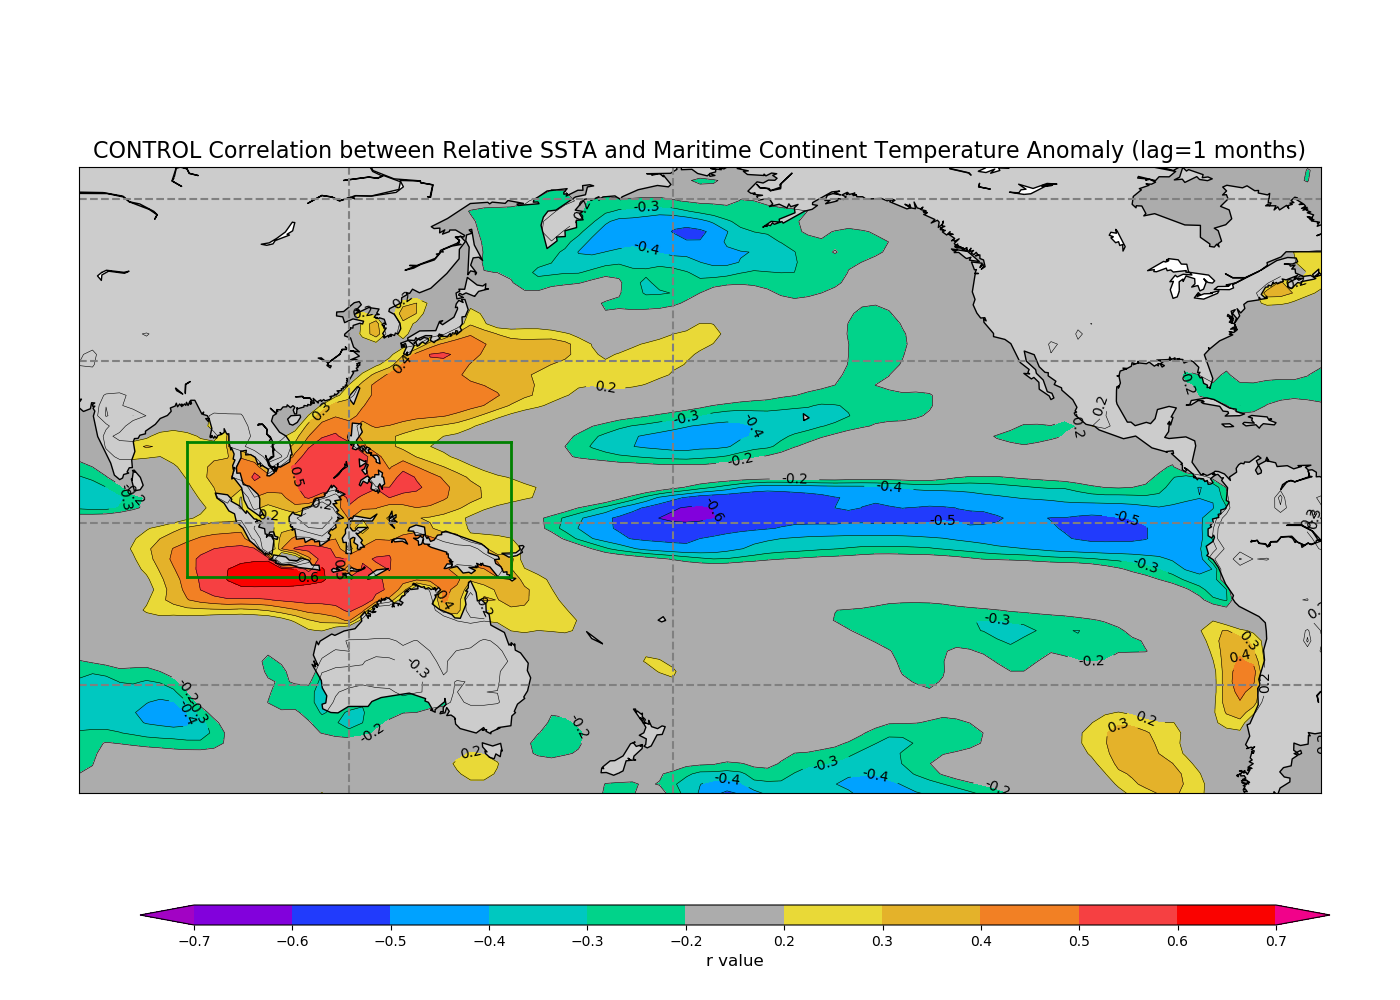
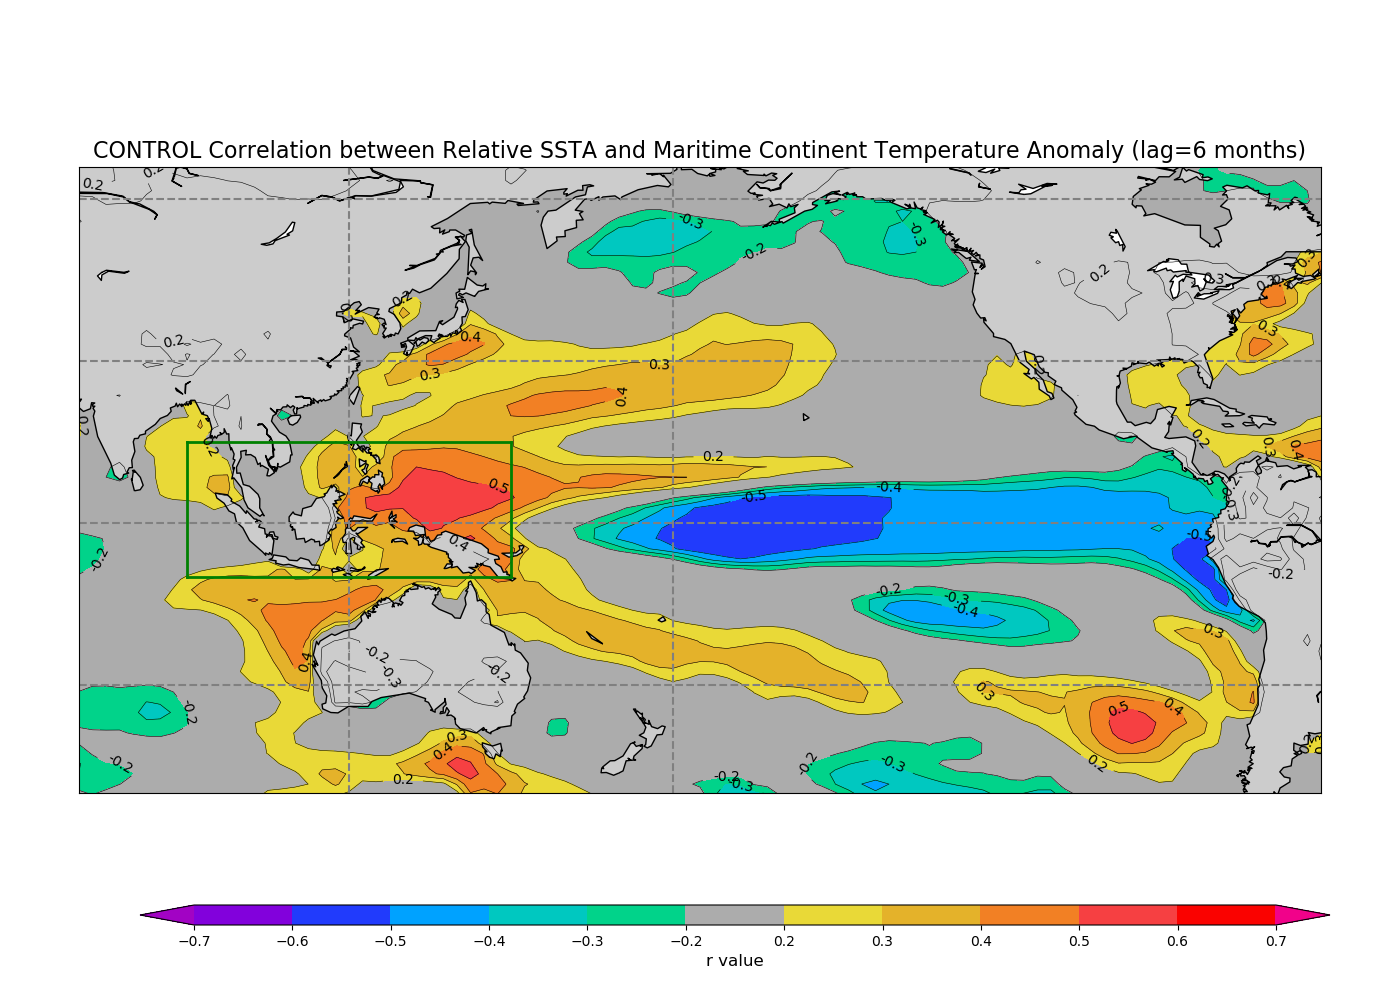
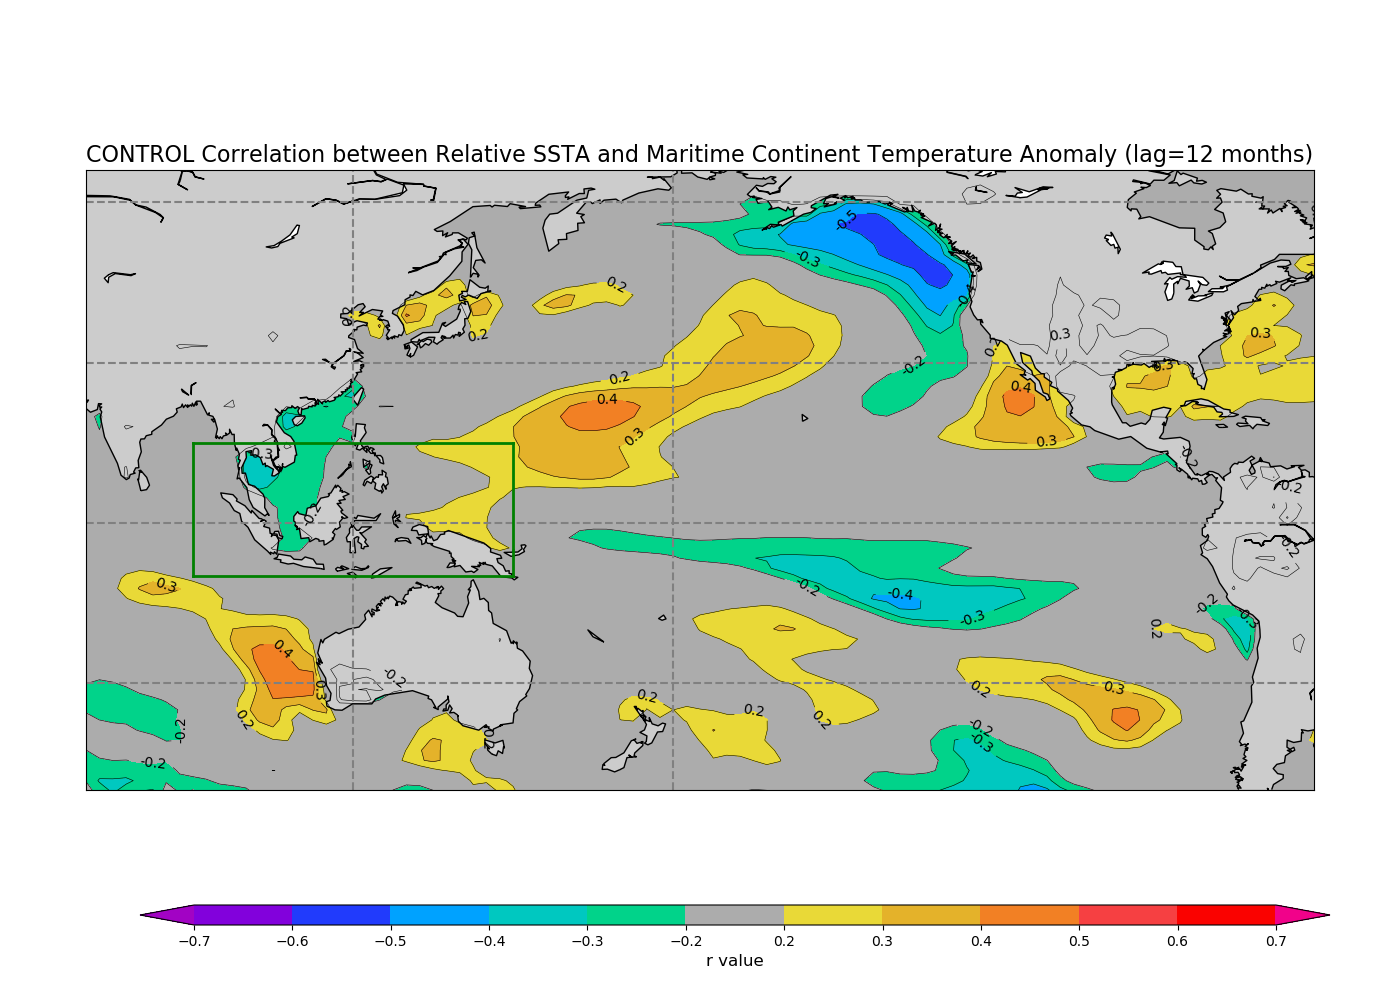
There
is a clear positive correlation in the western equatorial Pacific and
a negative correlation in the eastern equatorial Pacific at all lags.
This is consistent with RSSTs warming in response to a colder
Maritime Continent.
150
Tg +0 months
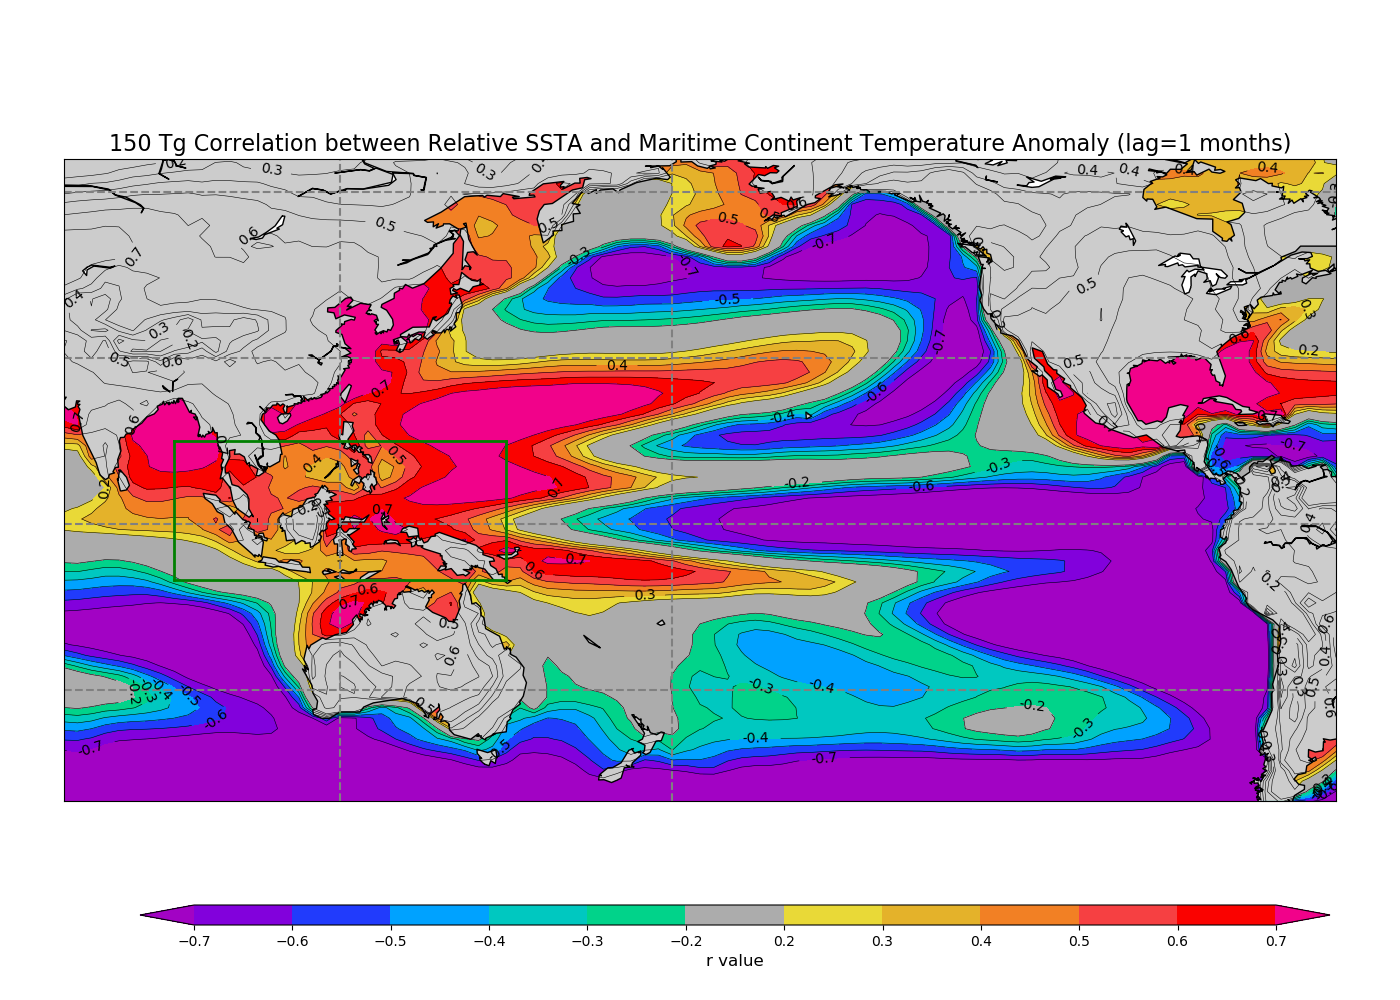
150 Tg +1 months
150
Tg +3 months
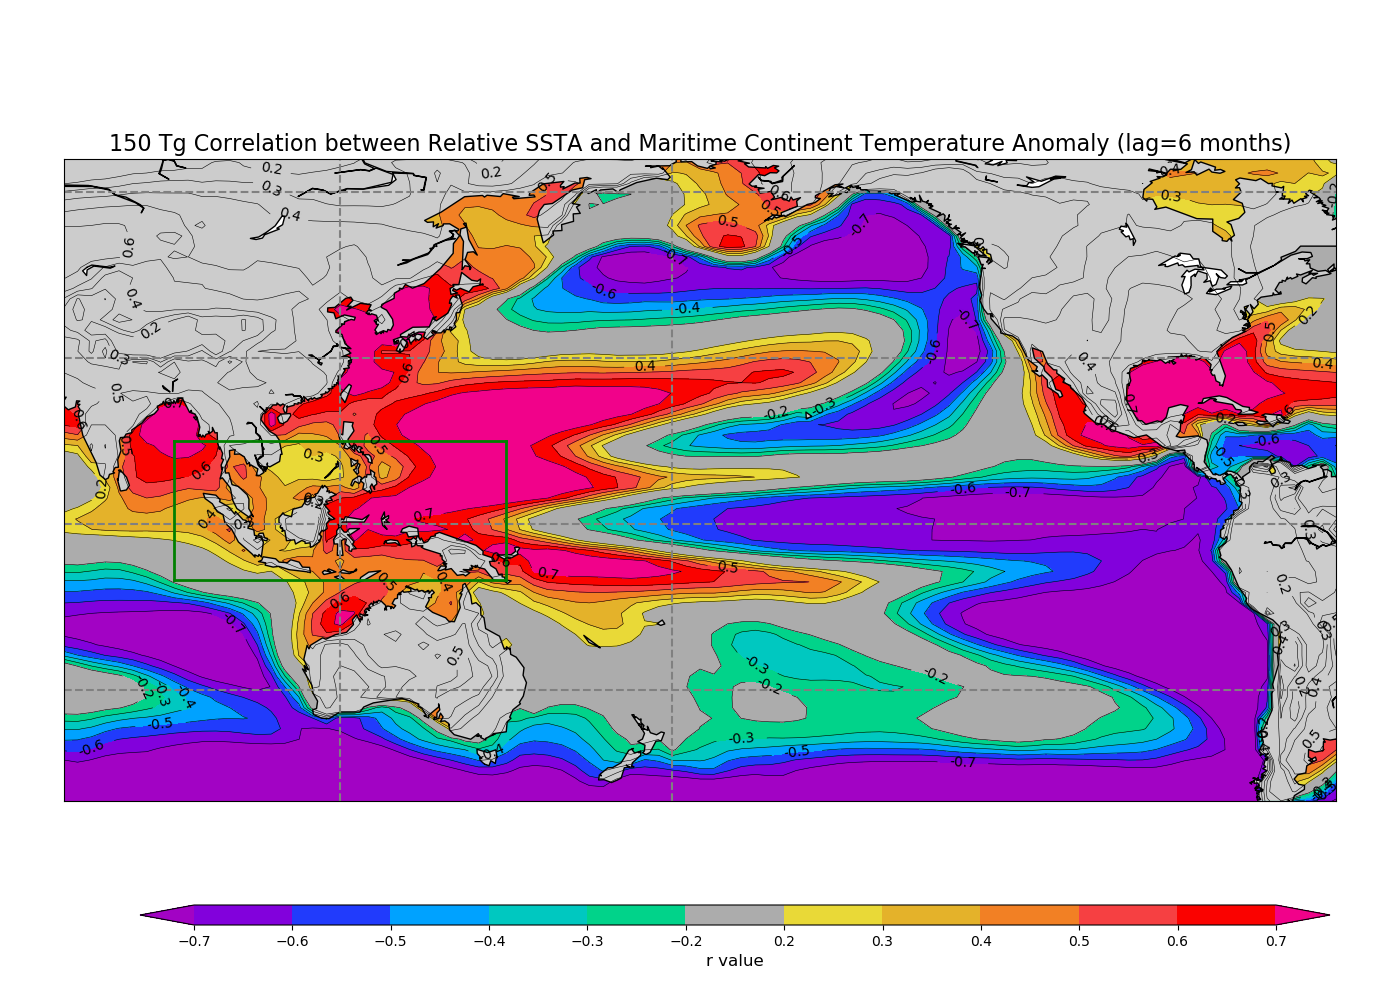
150 Tg +6 months
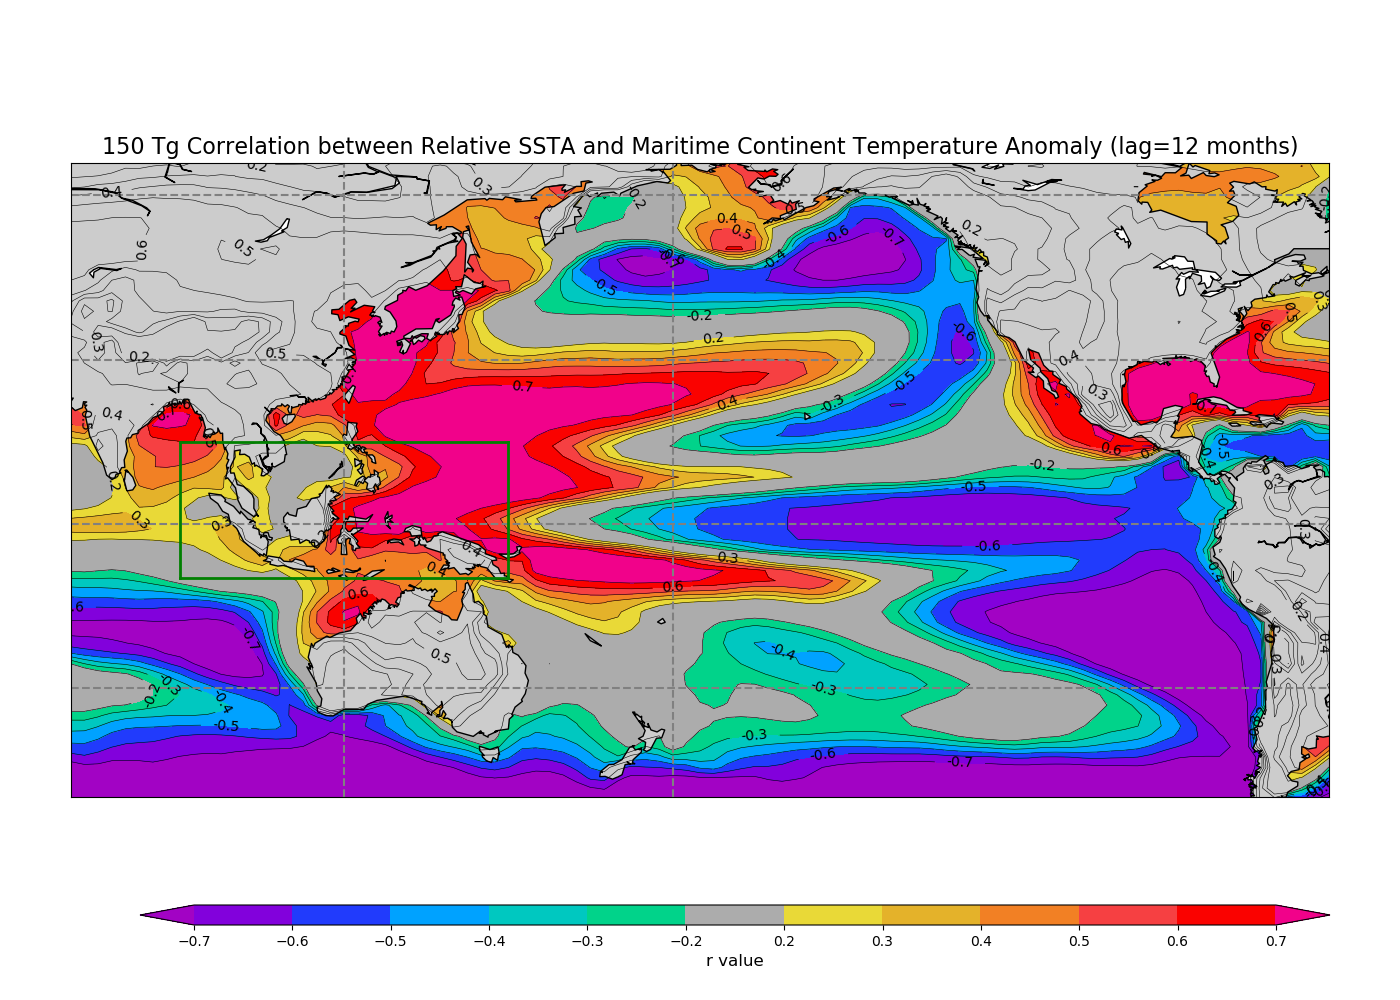
150
Tg +12 months
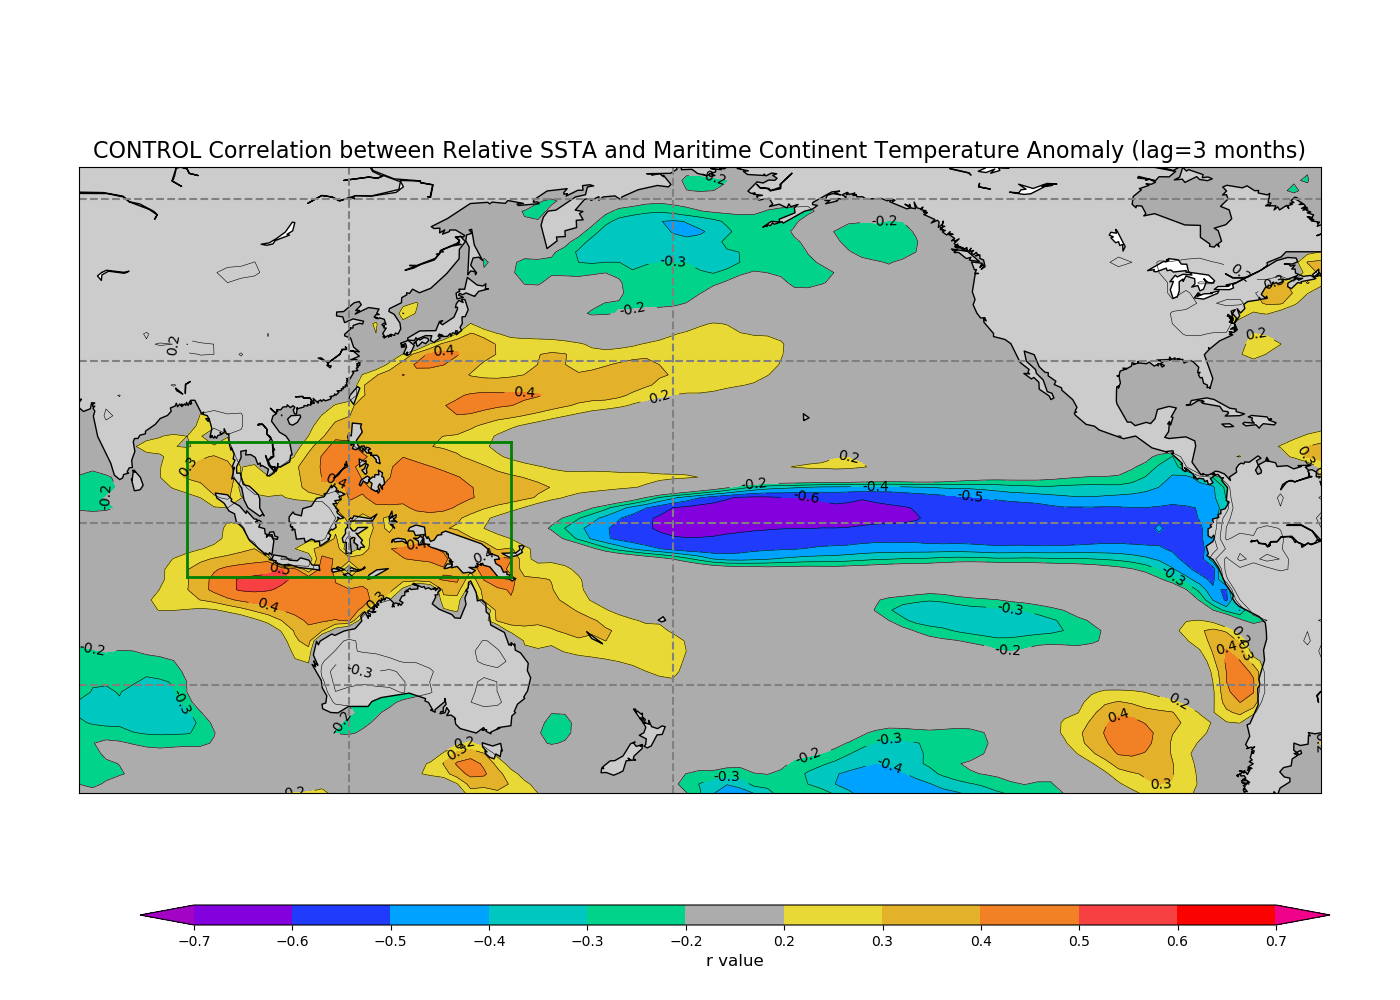
It is worth noting that there are similar correlations when using the CESM-WACCM4 control run. It is not unusual for contrasting temperature anomalies in the western and eastern Pacific even under normal conditions.
Control
+0 months
Control +1
months
Control +3 months
Control
+6 months
Control +12 months
|
|
|