Objective: Determine whether or not changes in the ITCZ across the Pacific are responsible for westerly wind anomalies that kickstart Bjerknes feedback and El Nino conditions. Python code.
OLD PLOTS of Plot of average ITCZ position with time (per basin):
|
|
|
|
|
|
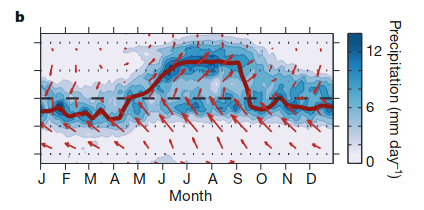
New plot of entire Pacific ITCZ location and varying measures of strength
|
|
|
|
|
|
|
|
|
Seasonal migration of the ITCZ over the Pacific in
CESM-WACCM4
a. Latitude of Maximum 850 hPa Wind
Convergence
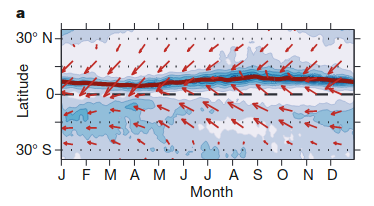
First, we
compare the ITCZ location in CESM-WACCM4 using the latitude of
maximum wind convergence at 850 hPa with figures from Schneider et
al., (2014) over the same locations. Compared to the reanalysis data
used by Schneider, the ITCZ as simulated by CESM-WACCM4 ventures
further south of the equator across the Pacific, in terms of the wind
convergence algorithm as well as if the maximum precipitation was
used. Over southeast Asia, the ITCZ exhibits more meridional
variability in the reanalysis compared to CESM-WACCM4. During the
summer, the reanalysis data shows the ITCZ as far north as 23N over
southeast Asia, while it never gets north of 10N in CESM-WACCM4.
However, here there are clear differences between the wind
convergence algorithm and the max latitude of precipitation method of
determining the location of the ITCZ. To rectify this, we will make
these same plots using an alternative method where maximum
precipitation is used.
Figure 1. Location
of ITCZ in CESM-WACCM4 and reanalysis over the Pacific Ocean (top)
and over Southeast Asia (bottom).
|
|
|
|
|
|
b. Latitude of Maximum 850 hPa Wind Convergence +
Precipitation
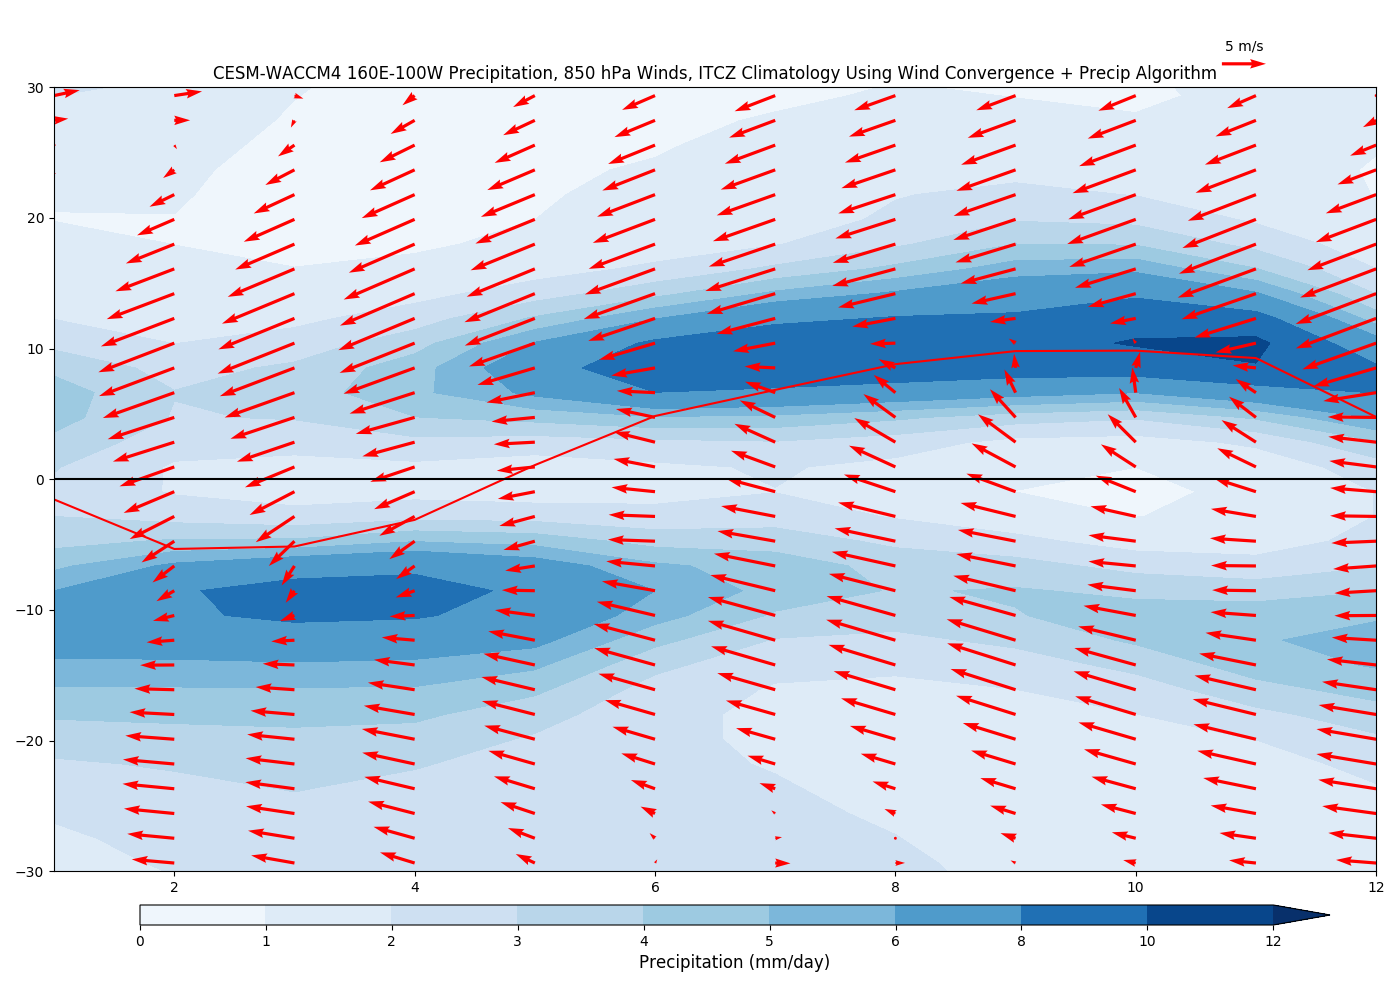
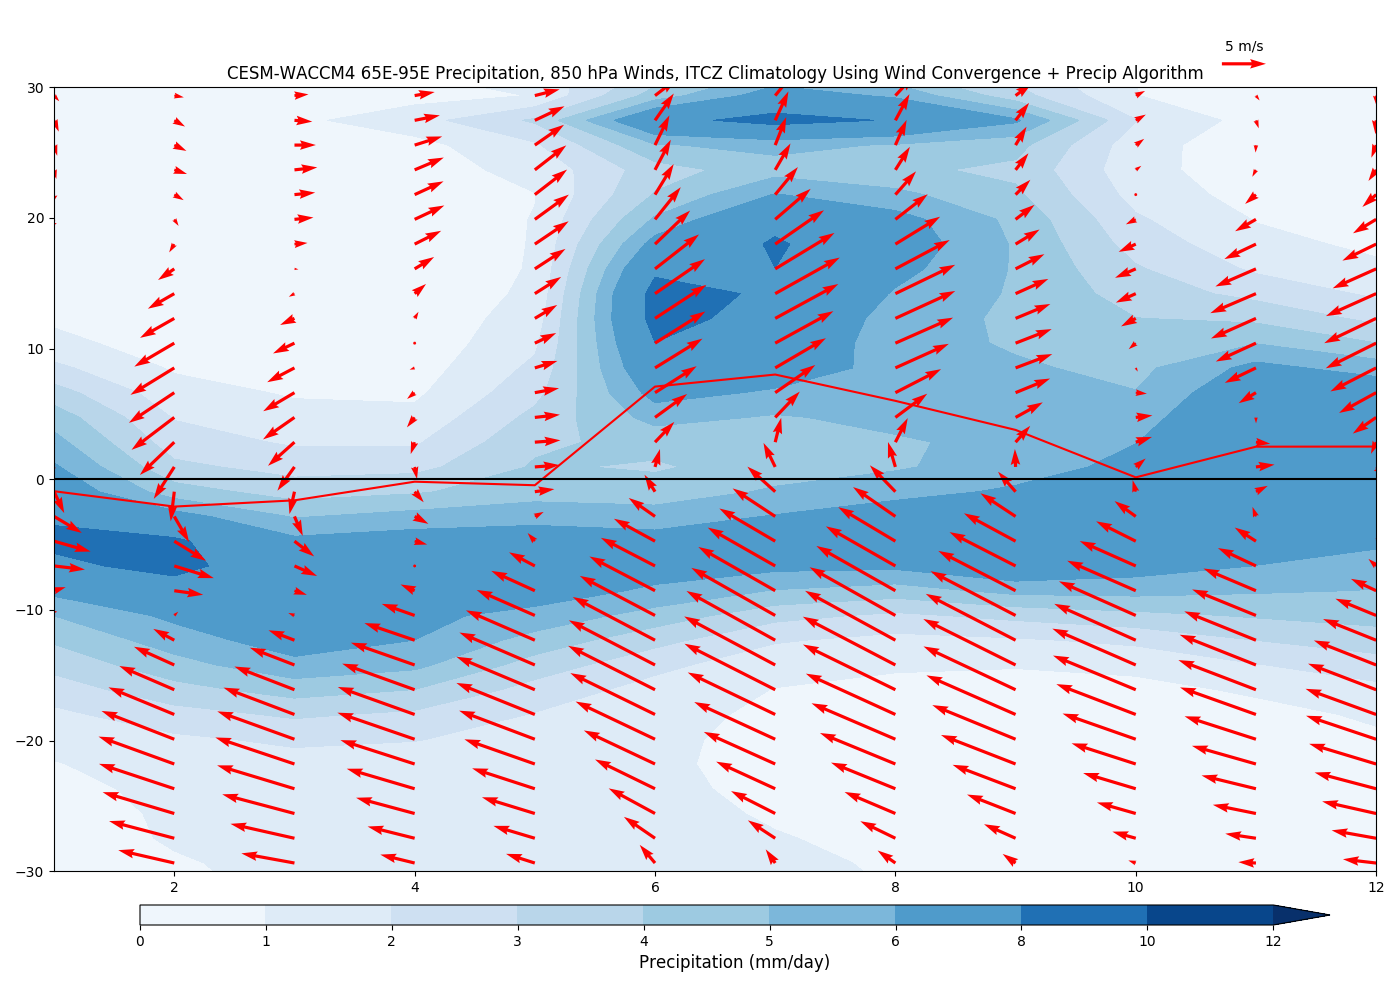
A comparison
of two different methods of ITCZ identification is shown below. The
top two images are Pacific Ocean and Southeast Asian ITCZ /
Precipitation climatologies by averaging together the location of the
ITCZ using wind convergence with the location of the ITCZ using the
latitude of maximum precipitation. The bottom images show the result
if only wind convergence is used to identify the ITCZ. This simply
pulls the ITCZ closer to the area of maximum precipitation, which has
the effect of shifting the ITCZ further north during the summer-fall
in the Pacific, and shifting the ITCZ further south during the
winter/spring in Southeast Asia. Because CESM-WACCM4 has a
fundamentally different precipitation pattern compared to this
reanalysis, using it does not result in any obvious benefits.
|
|
|
|
|
|
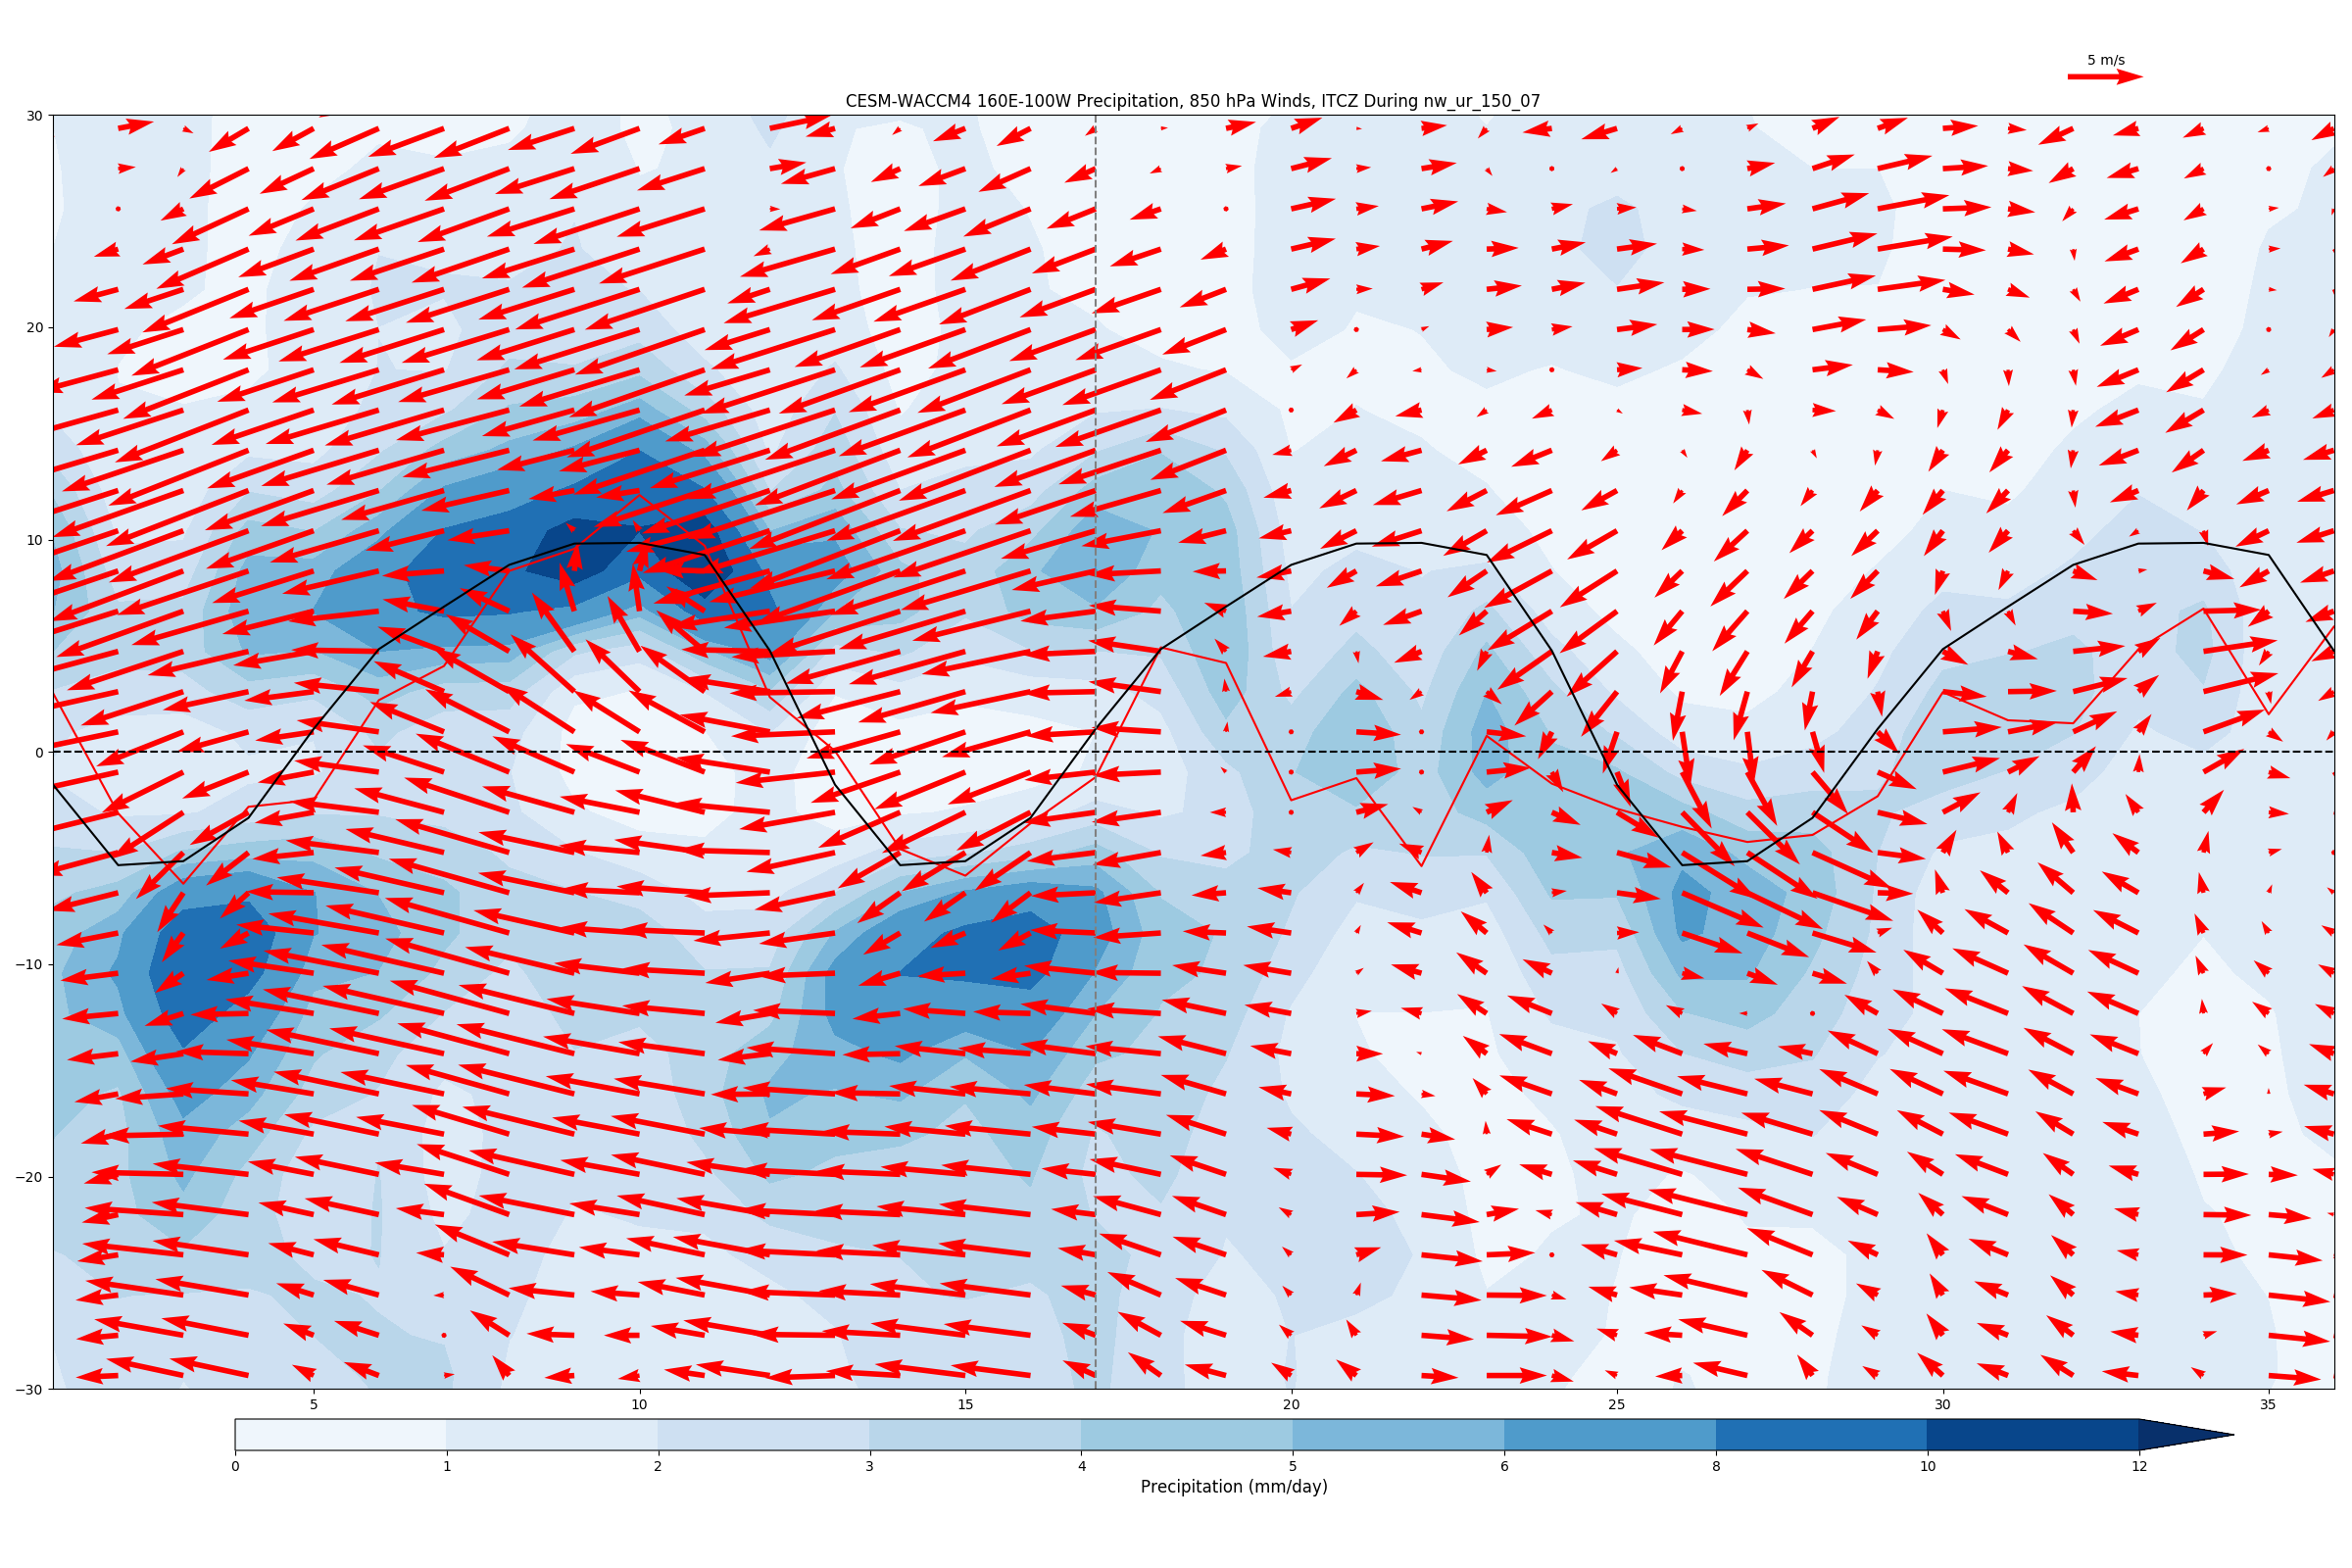
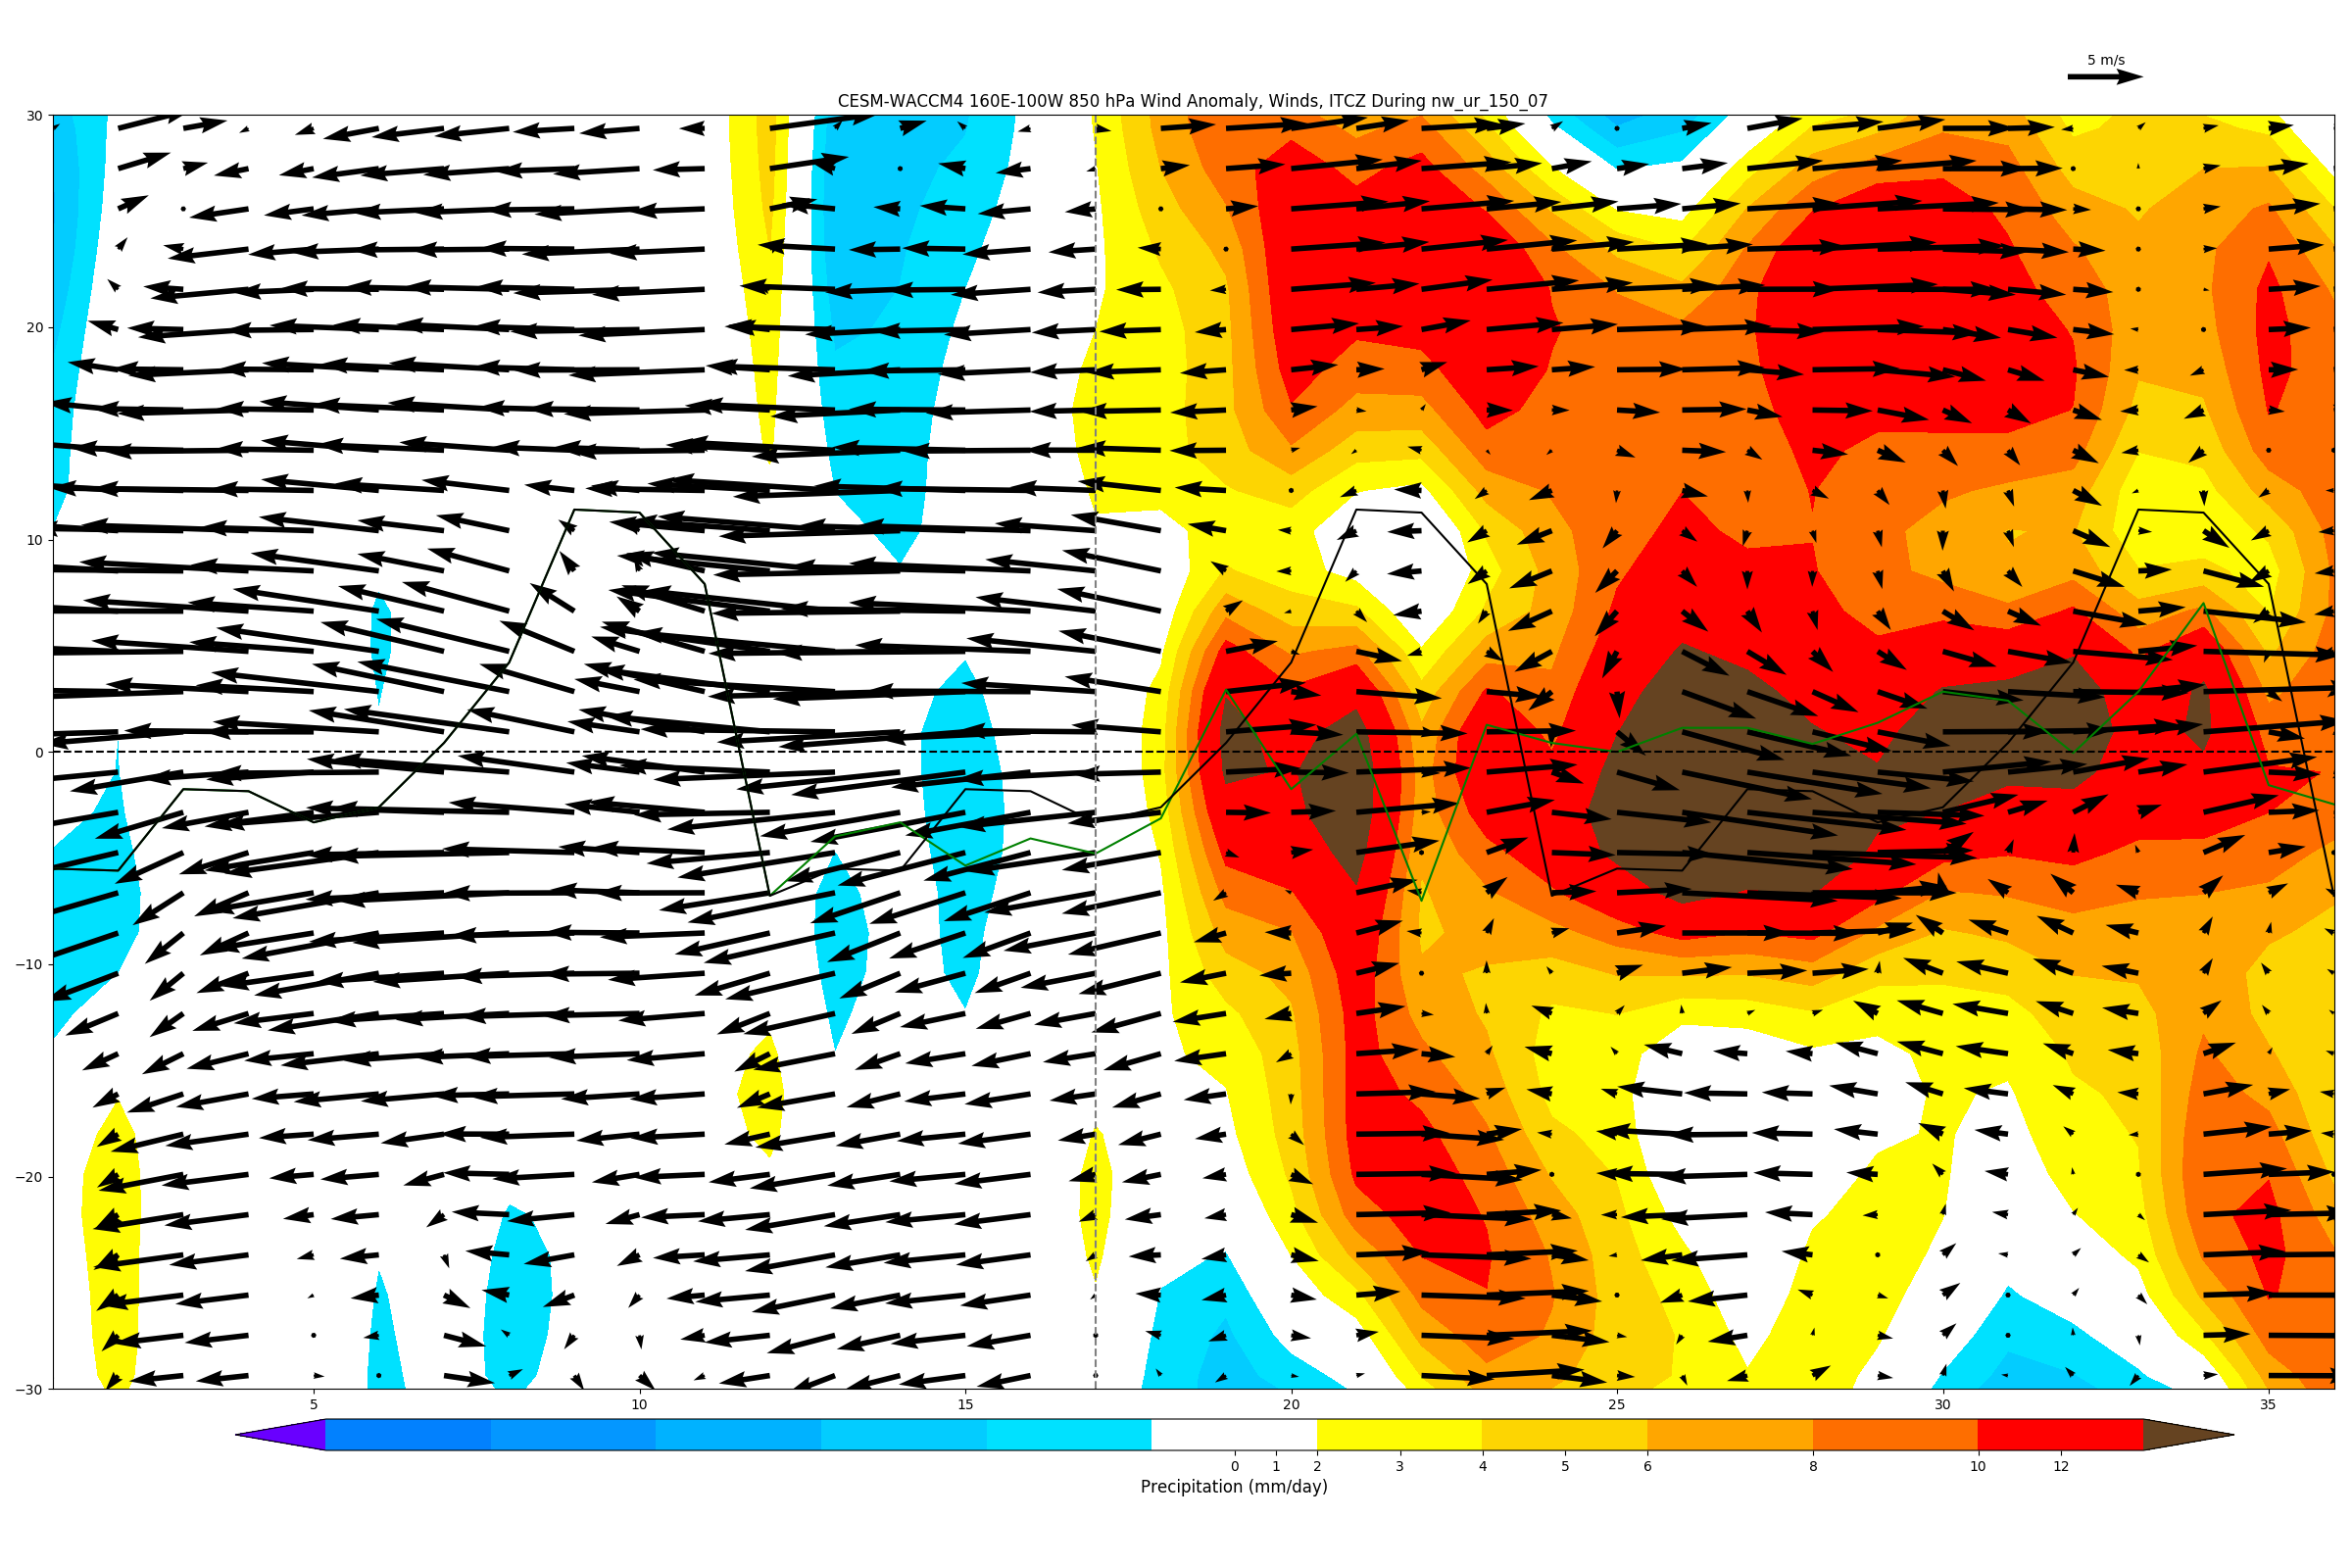
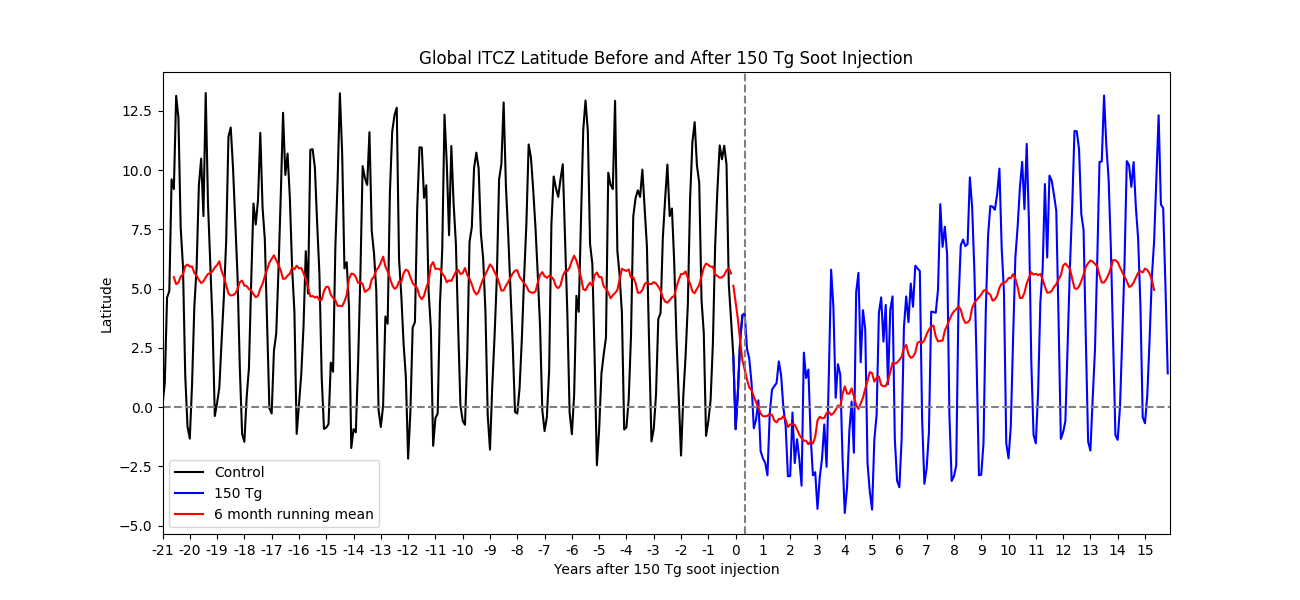
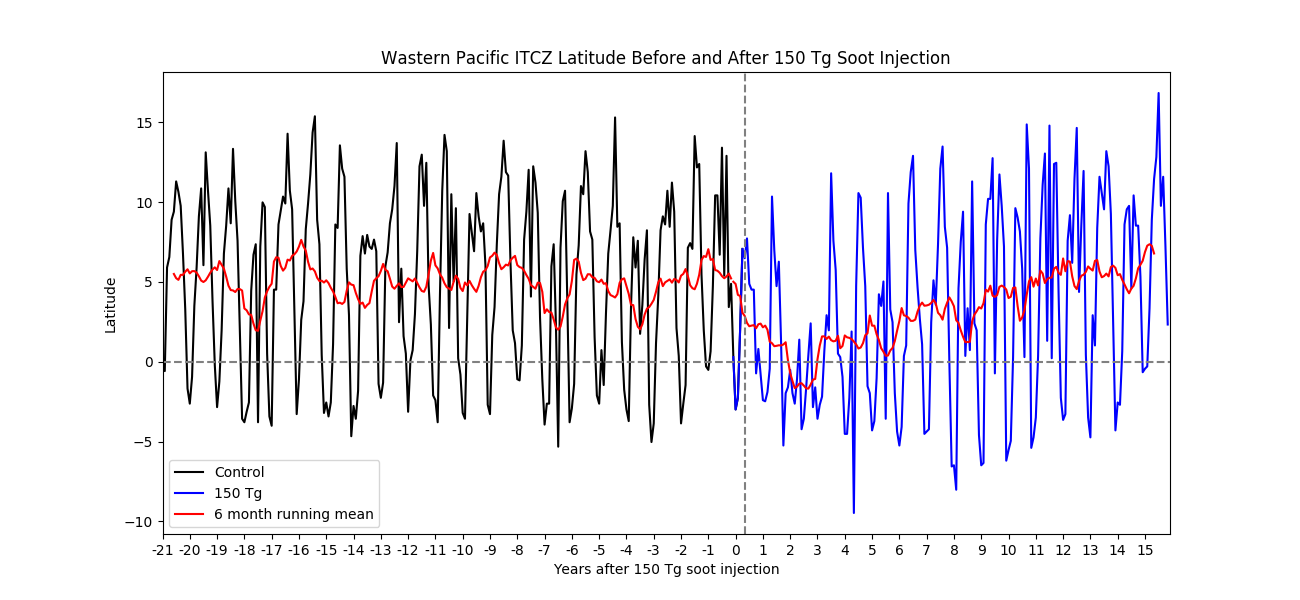
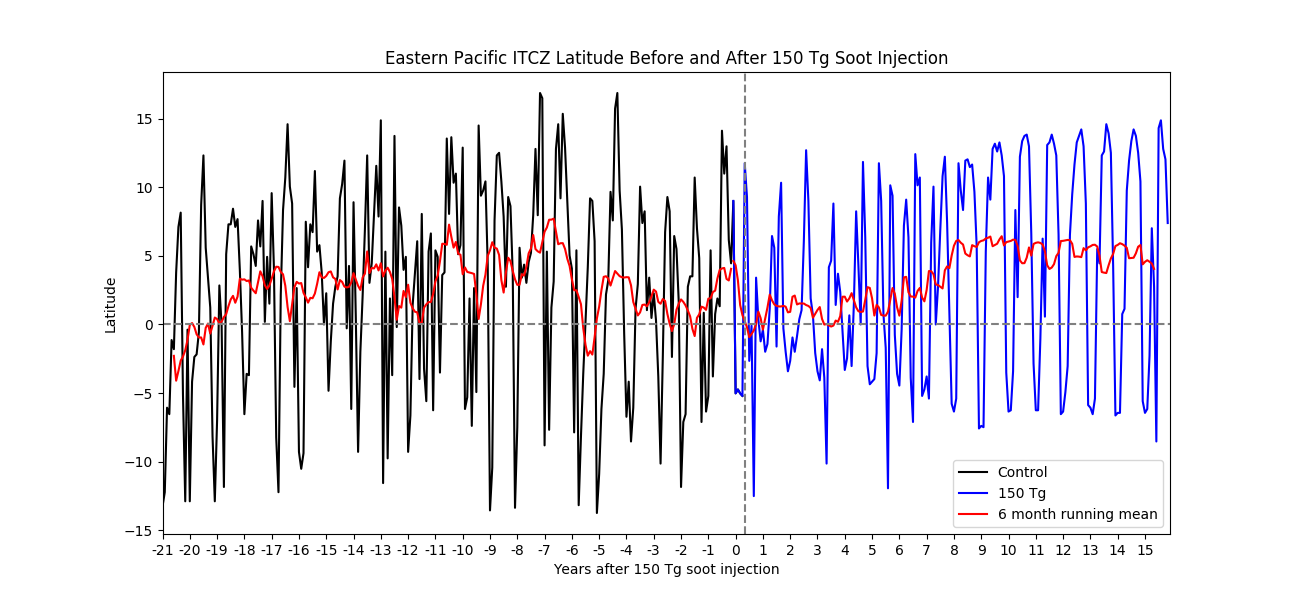
ITCZ changes following the injection of 150 Tg of soot:
|
|
|
|
Literature Review on Changes in the ITCZ through Various Means:
Yu, S. and Pritchard, M. 2019. A
Strong Role for the AMOC In Partitioning Global Energy Transport and
Shifting ITCZ Position in Response to Latitudinally Discrete Solar
Forcing in CESM1.2. Journal of Climate, Volume 32, DOI:
10.1175/JCLI-D-18-0360.1.
Ocean circulation responses to interhemispheric radiative
imbalance can damp north-south migrations of the ITCZ by reducing the
burden on atmospheric energy transport.
ITCZ migration entangled
with understanding of AMOC response to hemispherically asymmetric
radiative forcing.
The partitioning to external forcing has only
begun to receive wide attention.
Position of the ITCZ roughly
coincides with the ascending branch of the Hadley circulation-
hemispheric heating imbalance can be lessened if zonal-mean ITCZ
migrates toward a warmer hemisphere since thermally direct Hadley
cell transports energy following direction of its upper
branch.
[i.e., the energetic framework; see Schneider et al.
(2014) and Kang et al. (2018) for reviews]
The oceanic
circulation can also alter the position of the zonal-mean ITCZ by
reducing the burden of the atmospheric energy transport.
Ocean
dynamics can damp ITCZ shift responses to high-latitude forcing by
imposed cloud brightness (Kay et al. 2016), ocean albedo (Hawcroft et
al. 2017), sea ice cover (Tomas et al. 2016), or stratospheric
aerosols (Hawcroft et al. 2018).
More pronounced ITCZ shifts
occur when ocean dynamics are left out.
Hawcroft, M., Haywood, J., Collins, M., Jones, A. 2018. The contrasting climate response to tropical and extratropical energy perturbations. Climate Dynamics.
Issues with tropical precipitation in
models may be associated with: inadequate convection
parameterization, convective-dynamic coupling, ocean-atmosphere
coupling, implying the double-ITCZ problem may be of tropical
origin.
Might be worth it to perform a meridional energy
transport analysis for the nuclear winter case, which could help with
quantifying the impact to the ITCZ.
Summary of study
conclusions:
1. The response of tropical atmosphere to
hemispherically asymmetric energy perturbations in a coupled model is
highly dependent on the latitude of the forcing, with ocean +
atmosphere circulation responses to extratropical perturbations
modulating the tropical response.
2. The relationship between
tropical precip assymetry and cross-equatorial atmospheric energy
transport is very closely coupled, as is the relationship between
both those indices and tropical SST asymmetry.
3. The structural
biases in model which lead to biases in cross-equatorial energy
transport are resistant to change- takes a forcing equivalent to
twice the stratospheric AOD after Pinatubo over southern tropics to
correct cross-equatorial energy transport biases.
4. Biases in
tropical climate in models may have dependence on the particular
latitude of any albedo/energy budget biases or forcing.
Schneider, T,. Bischoff, and G. Haug, 2014: Migrations and dynamics of the intertropical convergence zone.Nature,513, 45–53,https://doi.org/10.1038/nature13636
Different ways to identify the ITCZ: tropical belt of deep
convective clouds or as maximum in-time mean precipitation.
Central
Atlantic and Pacific: ITCZ migrates between 9N and 2N.
Indian
Ocean and adjacent land surfaces: the ITCZ swings more dramatically
between avg latitudes of 20N and 8S, prompting seasonal rainfall
variations of the South Asian Monsoon.
ITCZ weakened or shifted
southward over the Holocene because summer insolation in NH weakened
with the precession of Earth's perihelion from NH towards SH.
ITCZ
does not follow insolation maximum nor sinusoidal seasonal variations
of IH temperature contrast- other mechanisms control position of ITCZ
and its rainfall intensity.
ITCZ rainfall fed by warm + moist
trade winds
Moist static energy of upper tropospheric air is
greater than that of the surface (really? Mostly due to gravity?)
the
ITCZ can be expected to lie near the 'energy flux equator.'
The
energy flux equator, and approximately the ITCZ position, depend to
1st order on cross-equatorial atmospheric energy flux F0
and on net energy input to the atmosphere at or near the equator:
div
F0 = S0 – L0 – O0
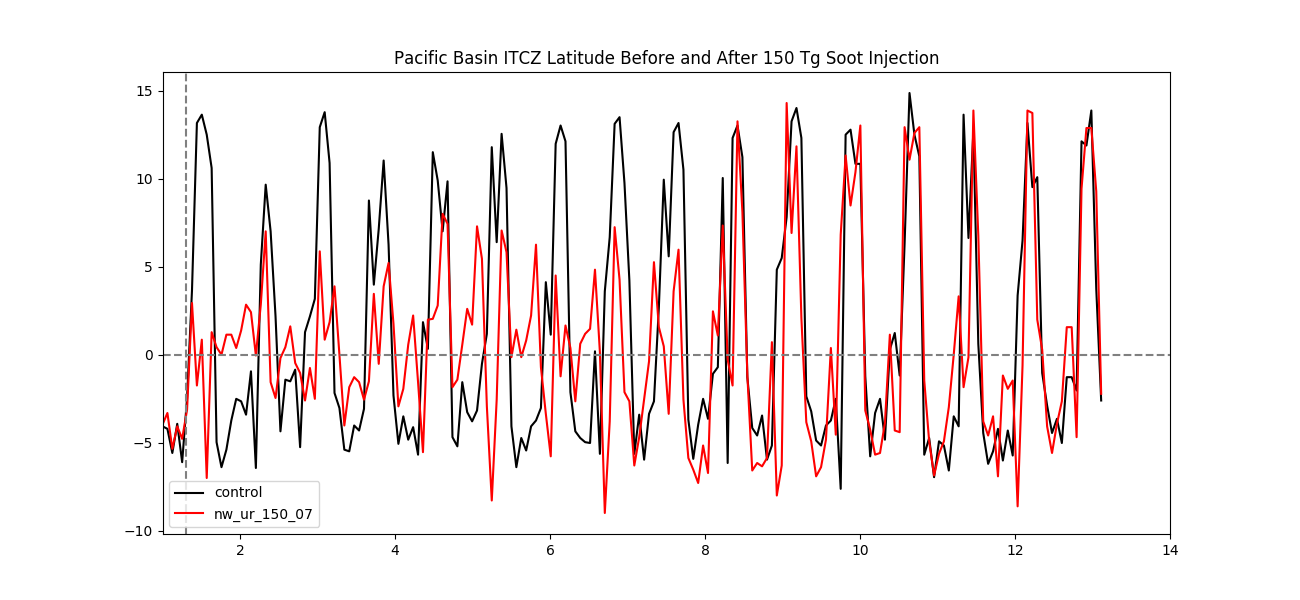 Latitude of ITCZ using wind convergence algorithm over the Pacific
Ocean during nuclear winter.
Latitude of ITCZ using wind convergence algorithm over the Pacific
Ocean during nuclear winter.
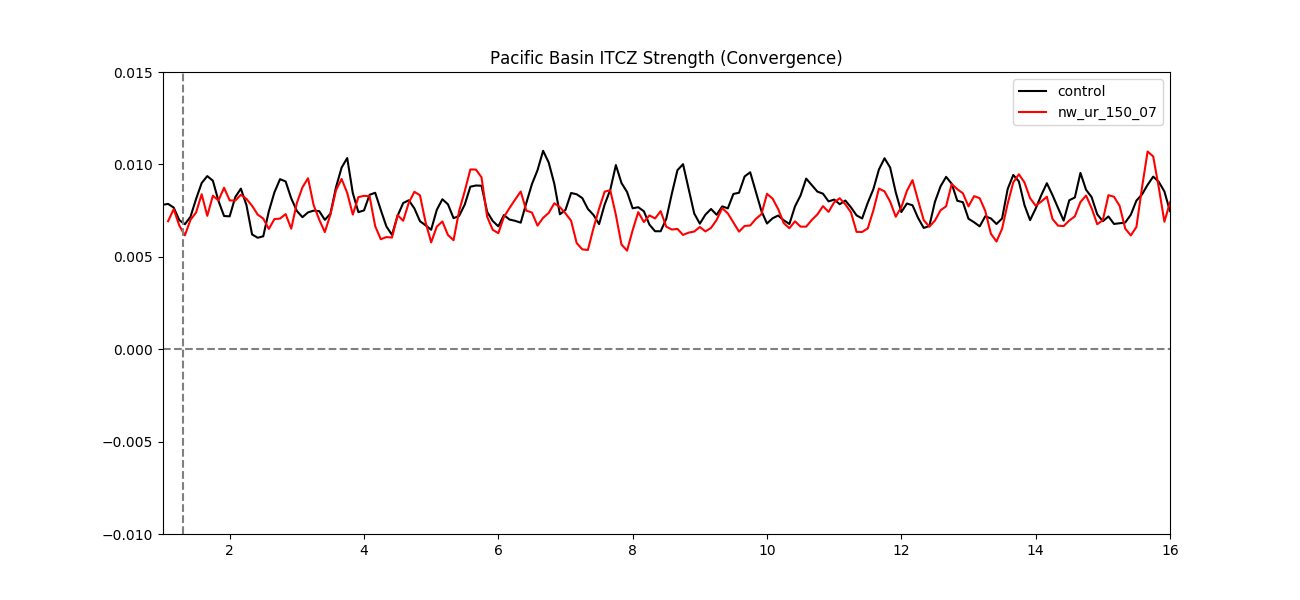 Value of convergence at the latitude of the ITCZ across the
Pacific. A weakening of convergence is observed during the summer
months of the 150 Tg nuclear winter run if you use the surface
winds. However, the signal is significantly weakened when the 850
hPa level is used.
Value of convergence at the latitude of the ITCZ across the
Pacific. A weakening of convergence is observed during the summer
months of the 150 Tg nuclear winter run if you use the surface
winds. However, the signal is significantly weakened when the 850
hPa level is used.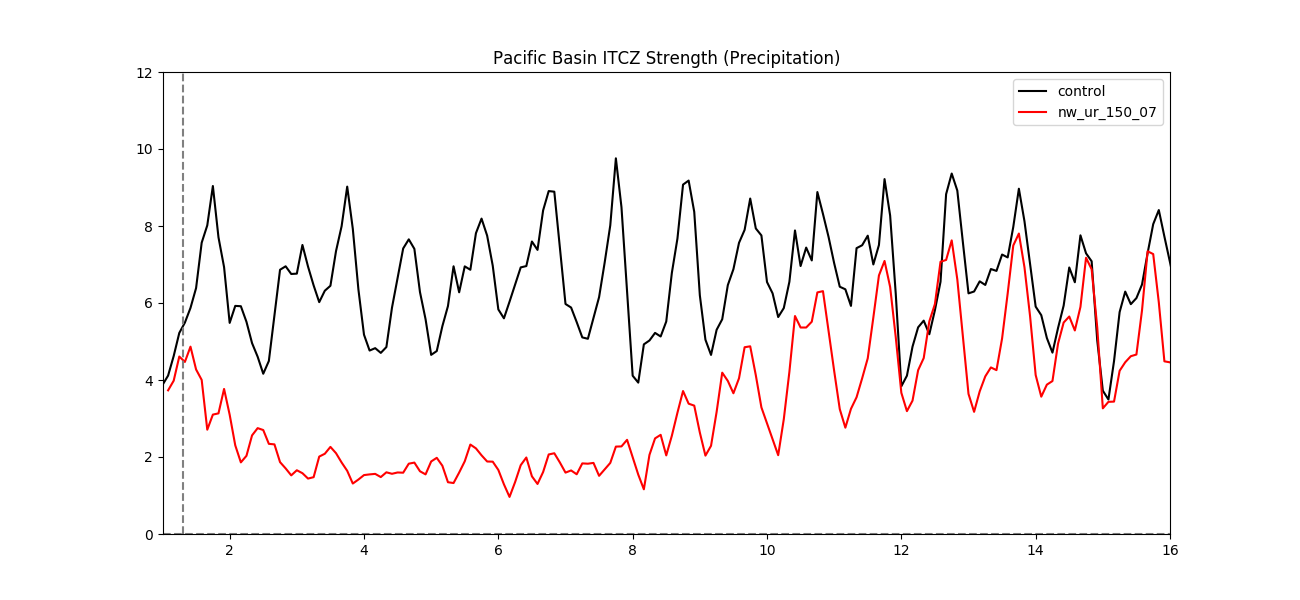 Amount
of precipitation at the latitude of the ITCZ across the Pacific. A
clear weakening is observed for 8 years, before the precipitation
pattern resumes a maximum during summer, which still is weaker
than the control run. 14 years after the injection of soot, the
ITCZ strength in terms of precipitation reaches pre-war levels.
Amount
of precipitation at the latitude of the ITCZ across the Pacific. A
clear weakening is observed for 8 years, before the precipitation
pattern resumes a maximum during summer, which still is weaker
than the control run. 14 years after the injection of soot, the
ITCZ strength in terms of precipitation reaches pre-war levels.
 Fig
2a.
Fig
2a. 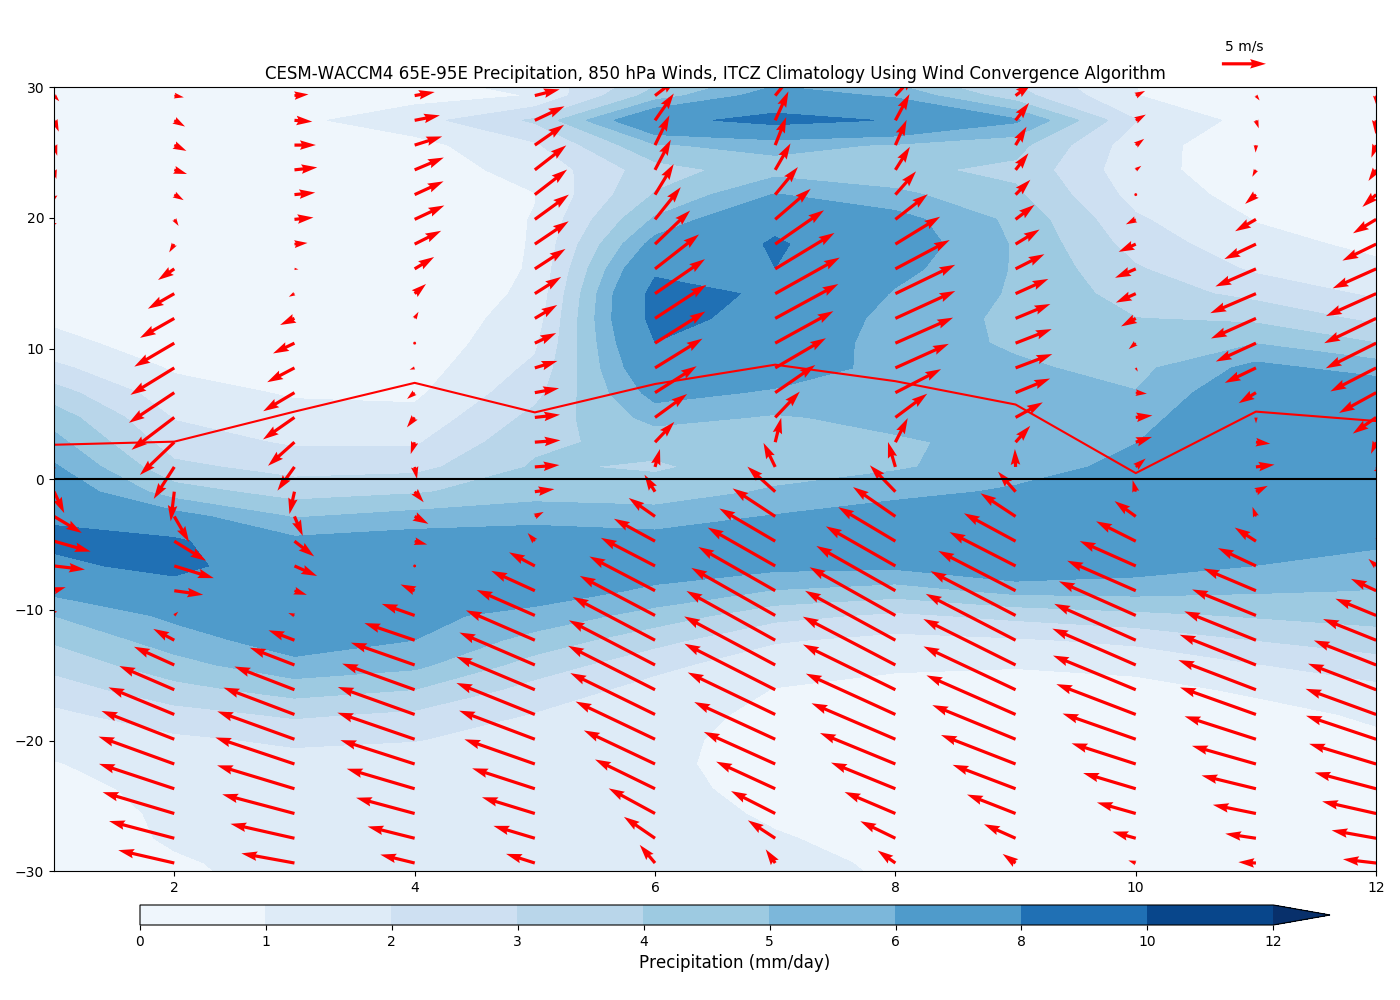
 Fig
2b.
Fig
2b.