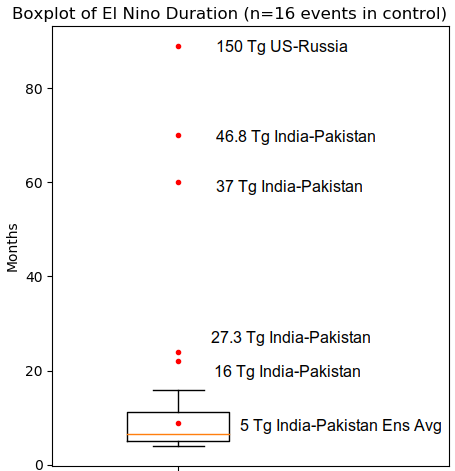
Statistics on El Nino Duration
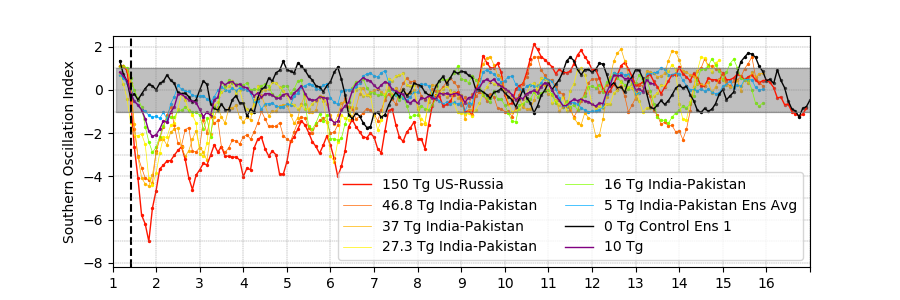
I calculate the duration of the first El Nino event across all six nuclear war scenarios and compare them with the mean El Nino duration during the control run (n=16 events over 720 months). I defined an El Nino event using the 5 month running mean of the Southern Oscillation Index (SOI). If this value was less than -0.5 for 3 consecutive months, an El Nino event had officially started and it ended when the SOI rose above -0.5.
The boxplot below shows the duration of the first El Nino event across all of the nuclear war simulations, using the definition as described above. The boxplot is constructed using the El Nino events across the control run.
In an attempt to find the initial injection size limit for a statistically significant increase in El Nino duration, I performed a 2nd degree polynomial fit to the SOI at each month as a function of mass size. This allows for a continuous SOI value, as a function of initial mass size and time. After performing this regression, I found that an injection near ~8.9 Tg would be just above the +/- 2 standard deviation cutoff from the mean in terms of the duration statistics. A 2nd degree polynomial fit of the actual SOI values in the five India-Pakistan simulation suggests an injection near 12 Tg would meet that cutoff. The plot below shows the El Nino duration for all of the India-Pakistan nuclear war simulations, where the purple dot is the regressed duration value and the blue line is the 2nd degree polynomial fit of the actual SOI values.
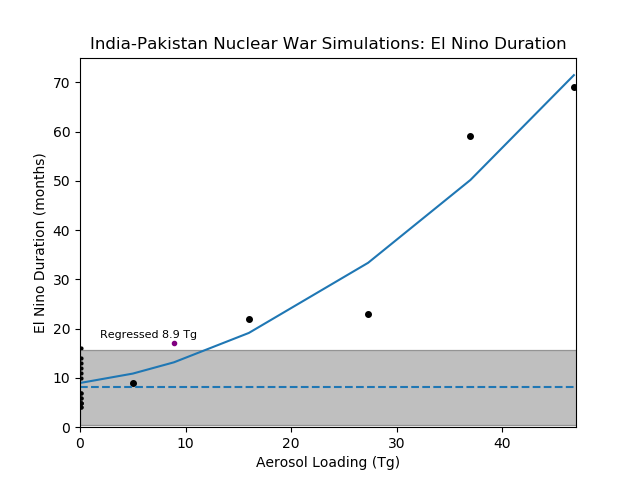
This helps with determining the theoretical limit for detecting an El Nino signal in a single nuclear war simulation. The El Nino statistics have been altered to the point where the El Nino event is fundamentally different from any that occurred during the unperturbed control runs.
As an illustration, below is a plot of the 3-month running mean SOI for all of the nuclear winter simulations, with an included line for a 10 Tg case, regressed using all of the other cases: