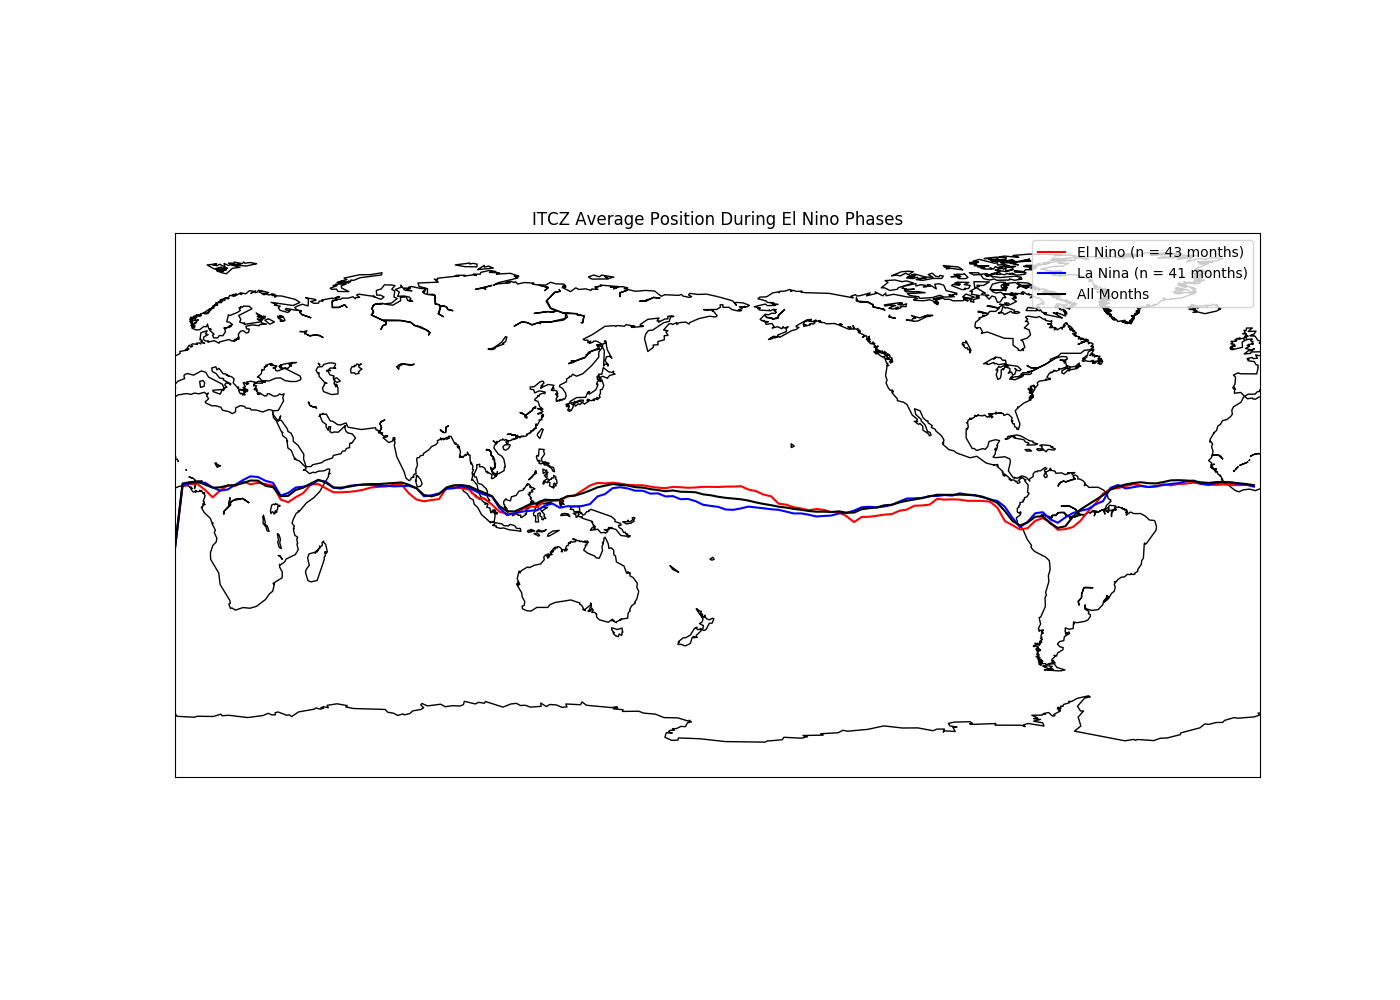
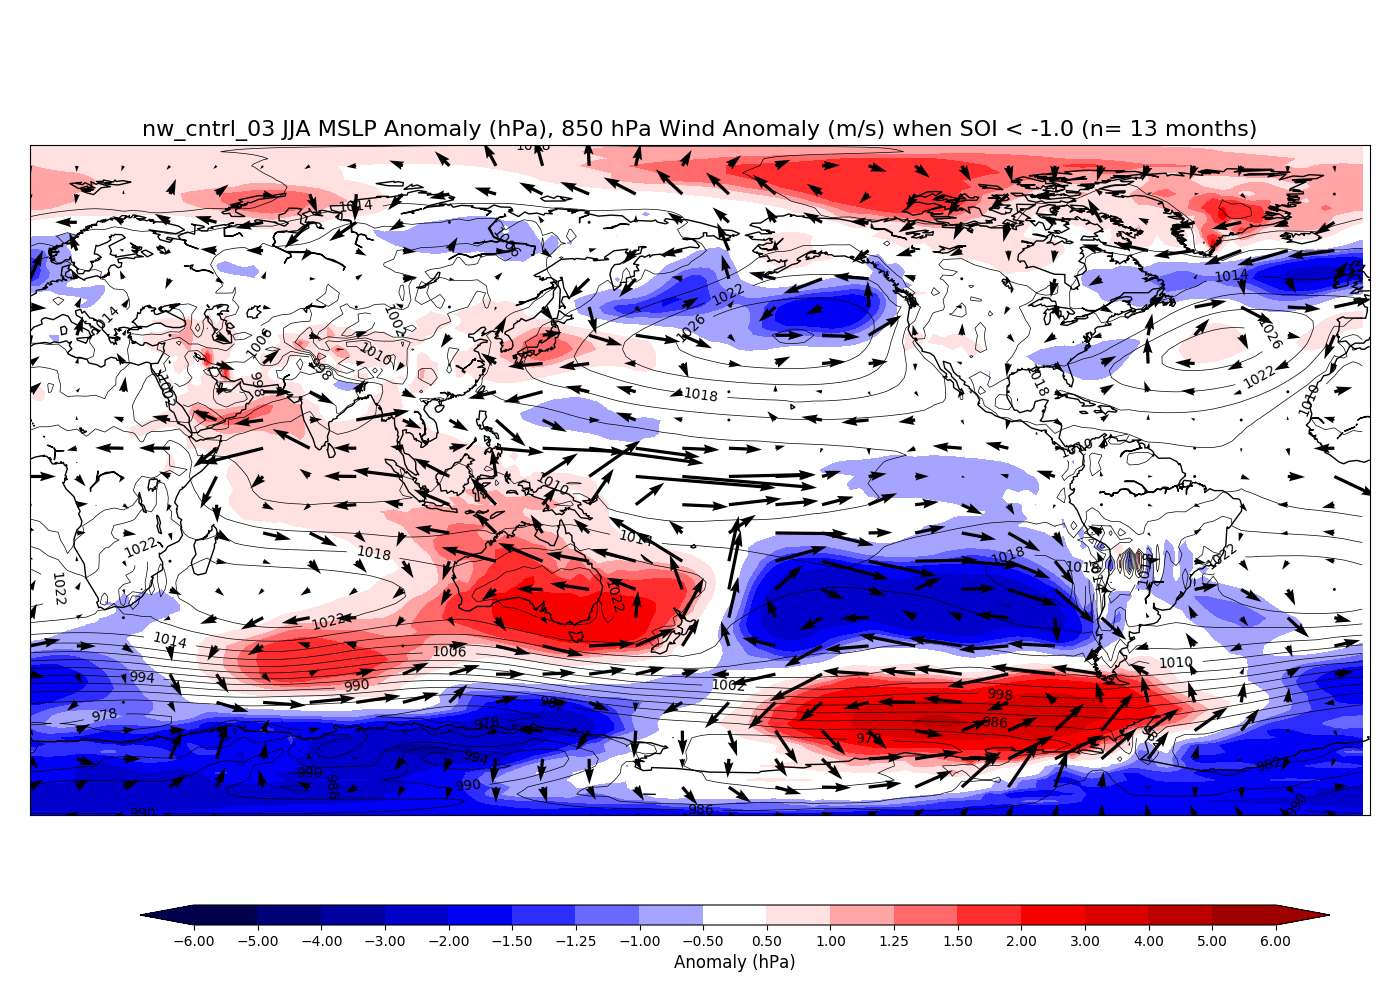
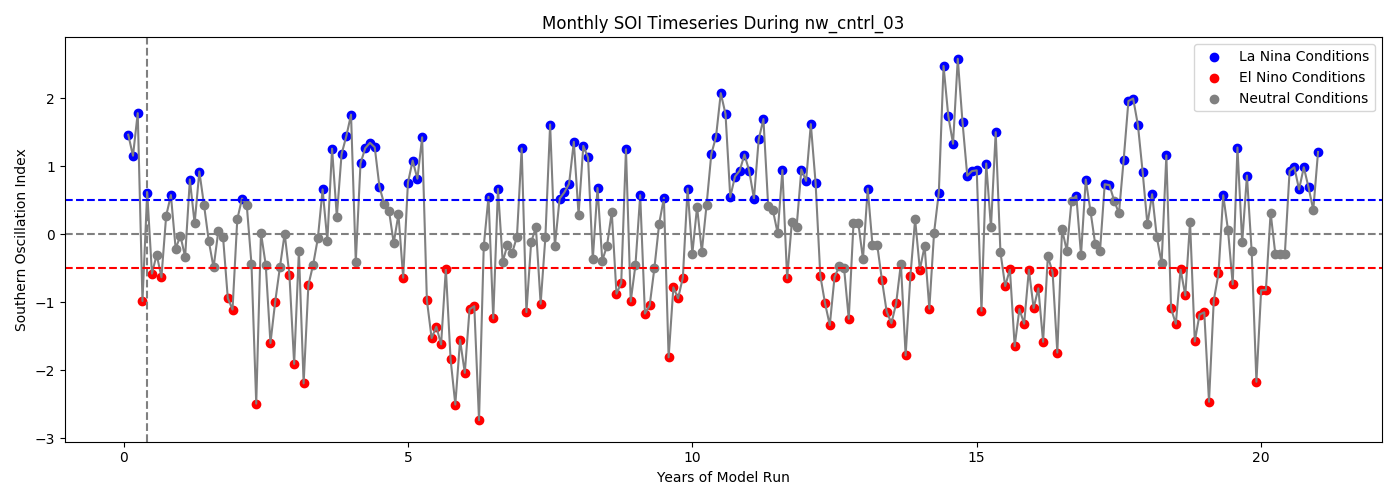
All months in the control run (nw_cntrl_03, 21 years) where the Southern Oscillation Index (SOI) is less than -1.0 (El Nino conditions, n = 43 months) are averaged together to create a composite of the average ITCZ position.


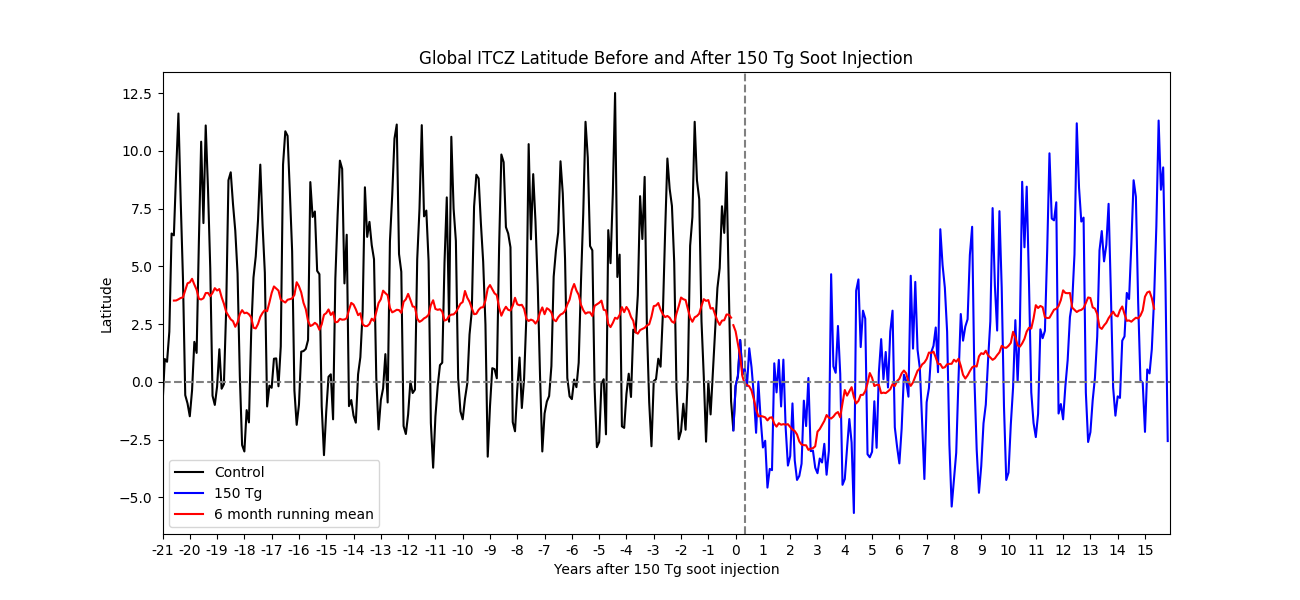
/home/josh/Documents/heatwaves/cat5/150Tg/nino/ITCZ-globe.png
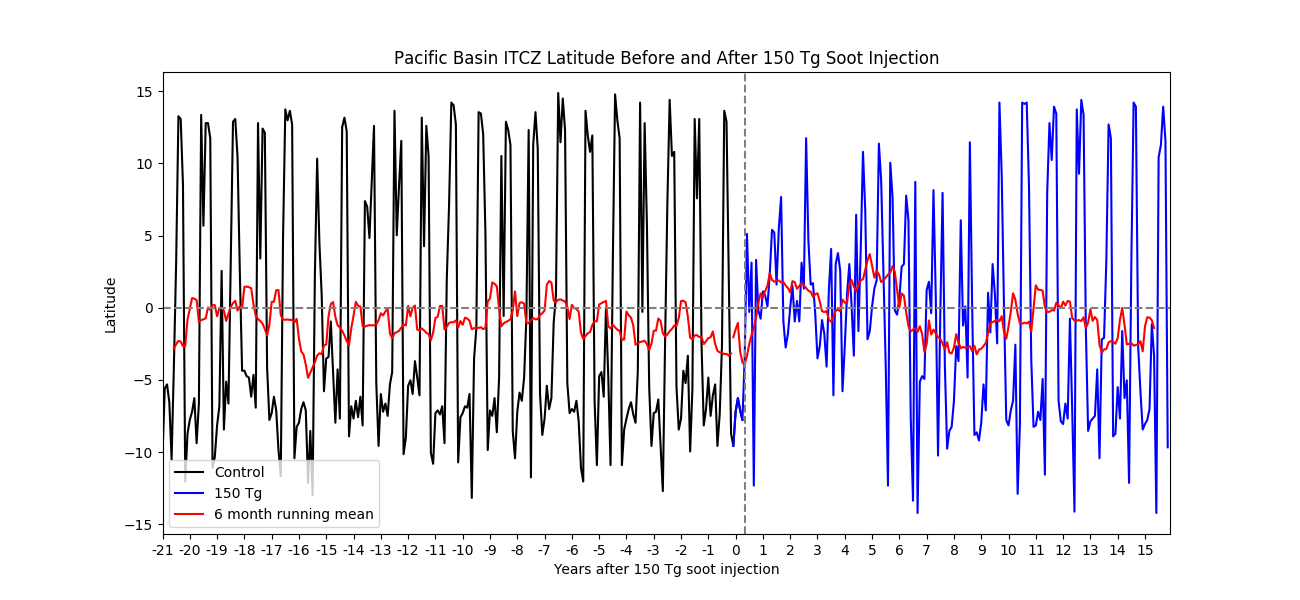
http://cat5.envsci.rutgers.edu/~jlc449/150Tg/nino/ITCZ-pacific.png
.png
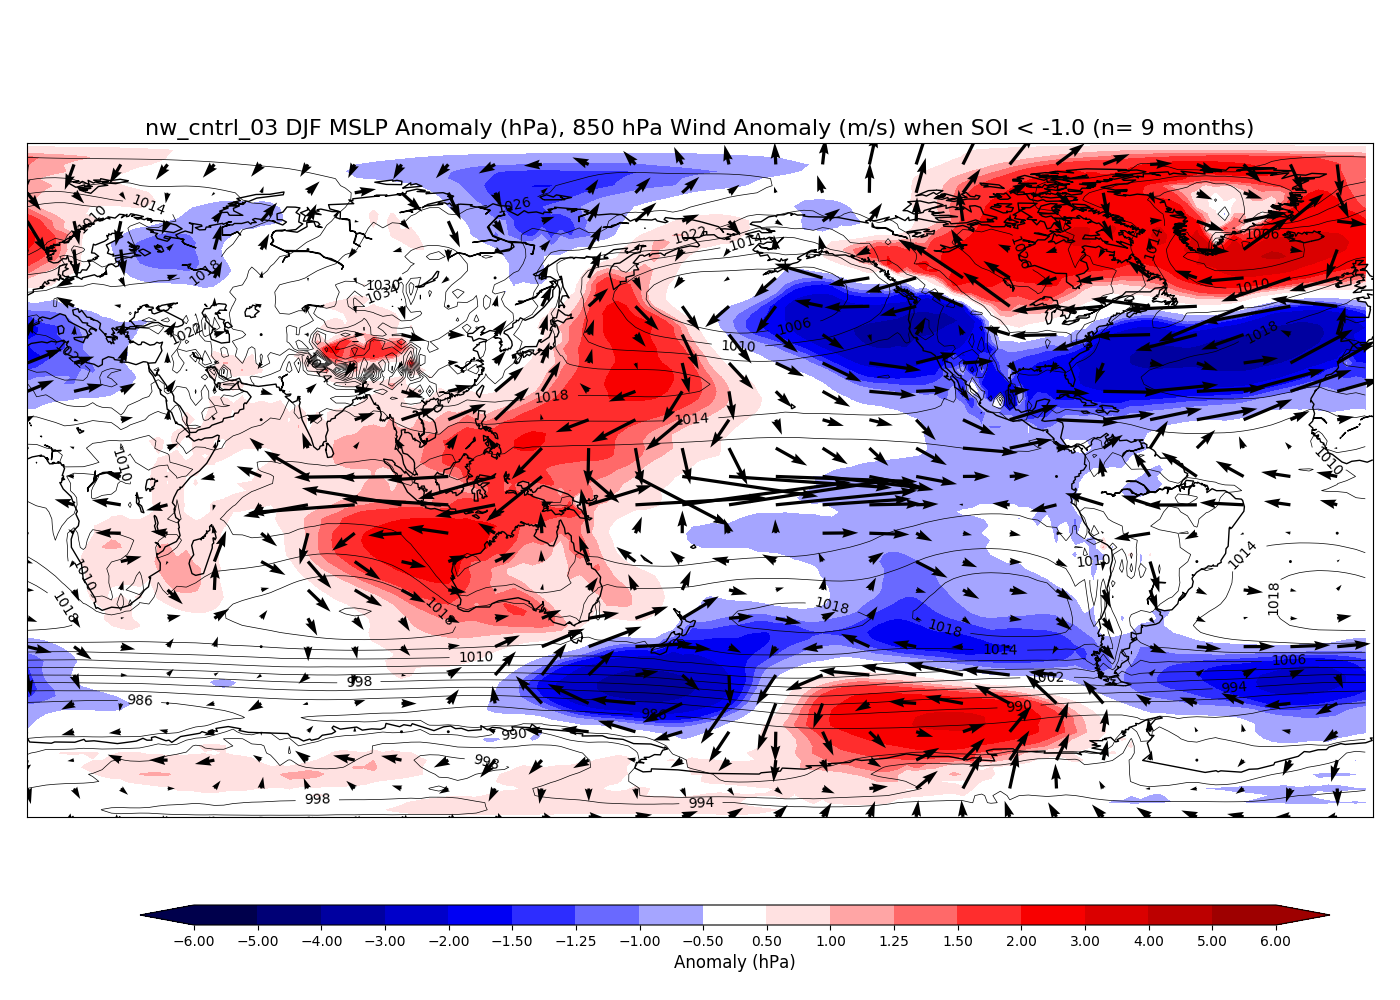
Control Run: Mean Sea Level Pressure and Wind Anomaly during JJA (left, n = 13) and DJF (right, n = 9) months with El Nino conditions.
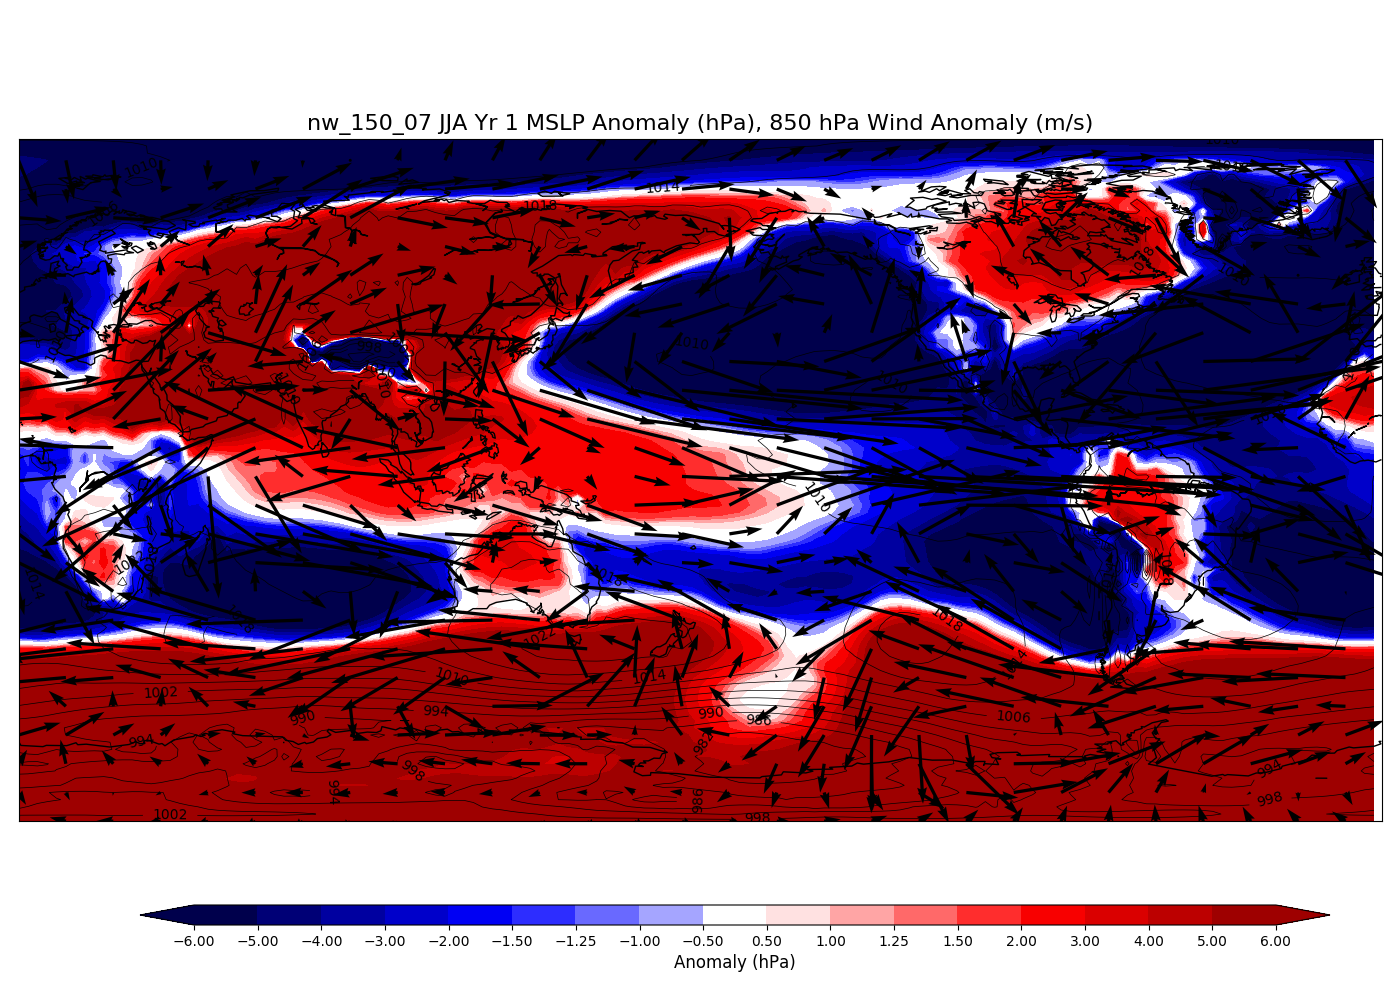
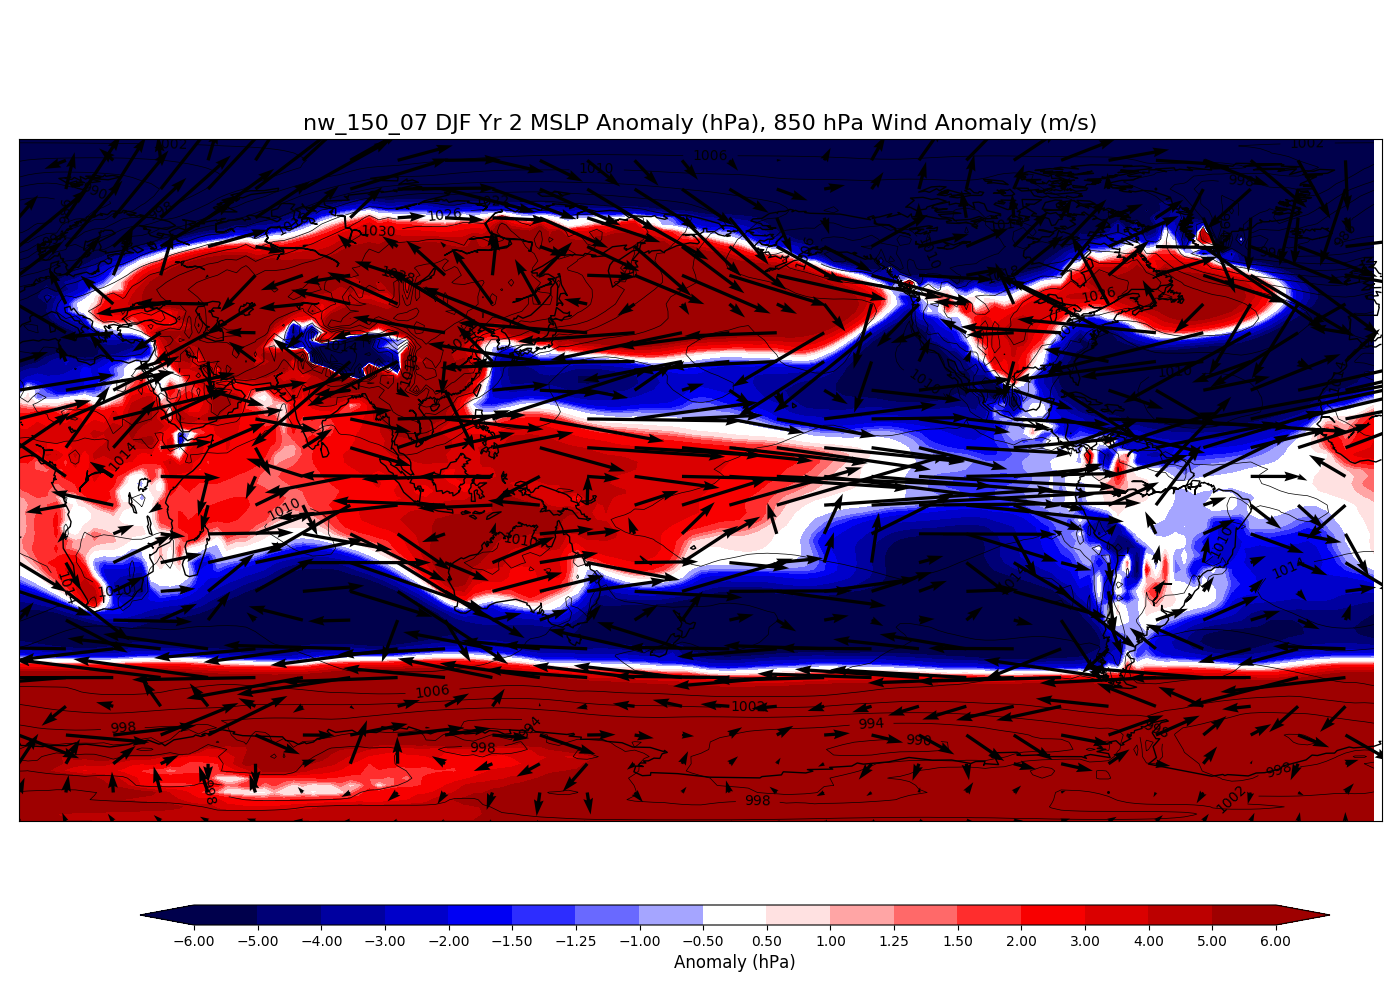
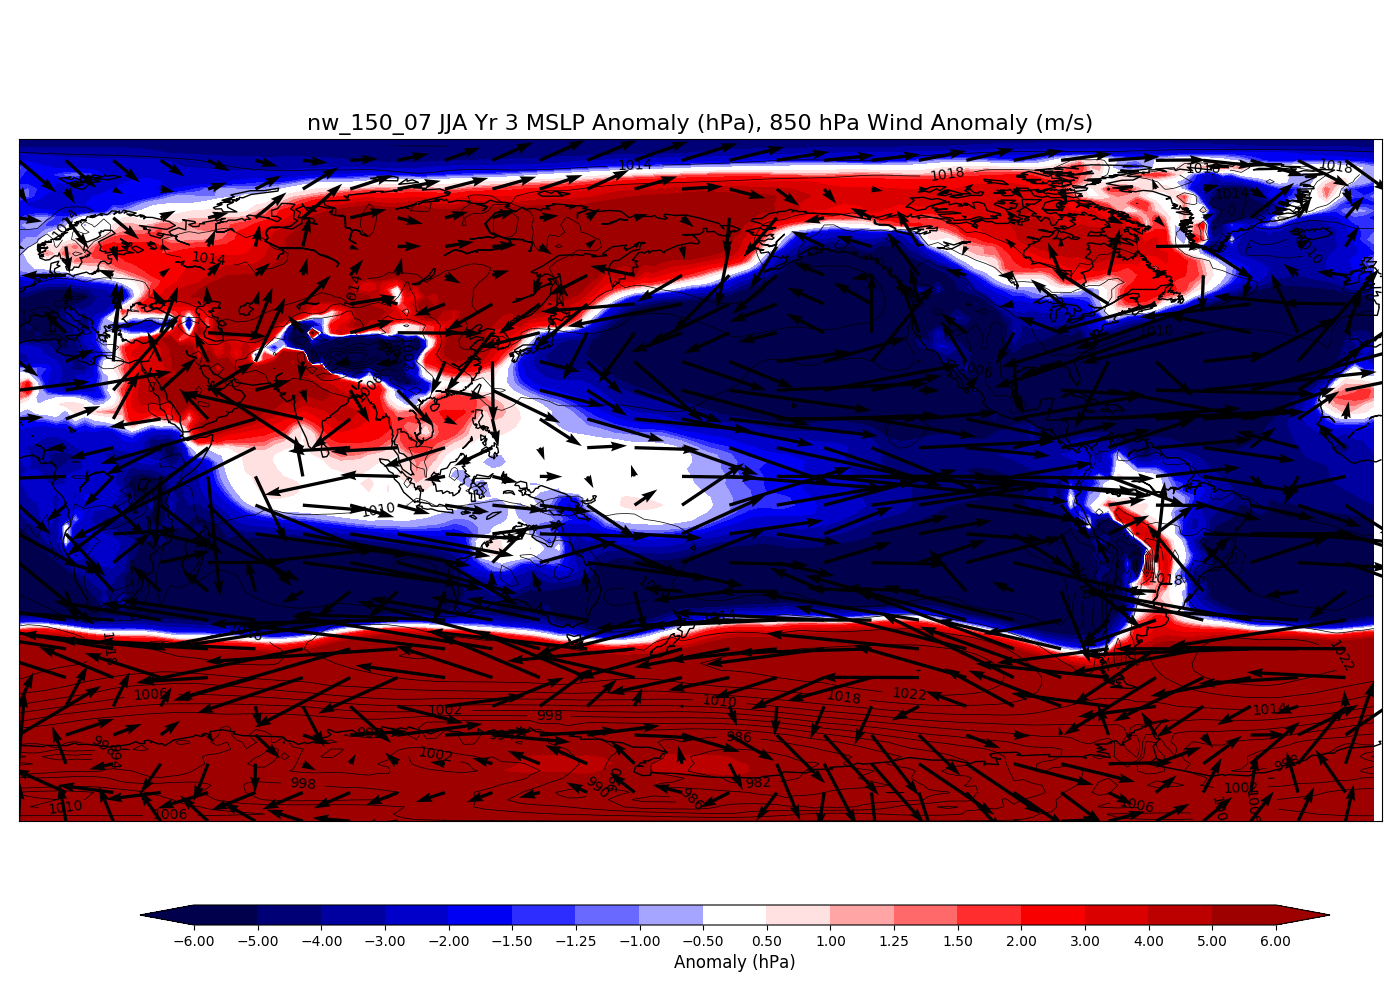
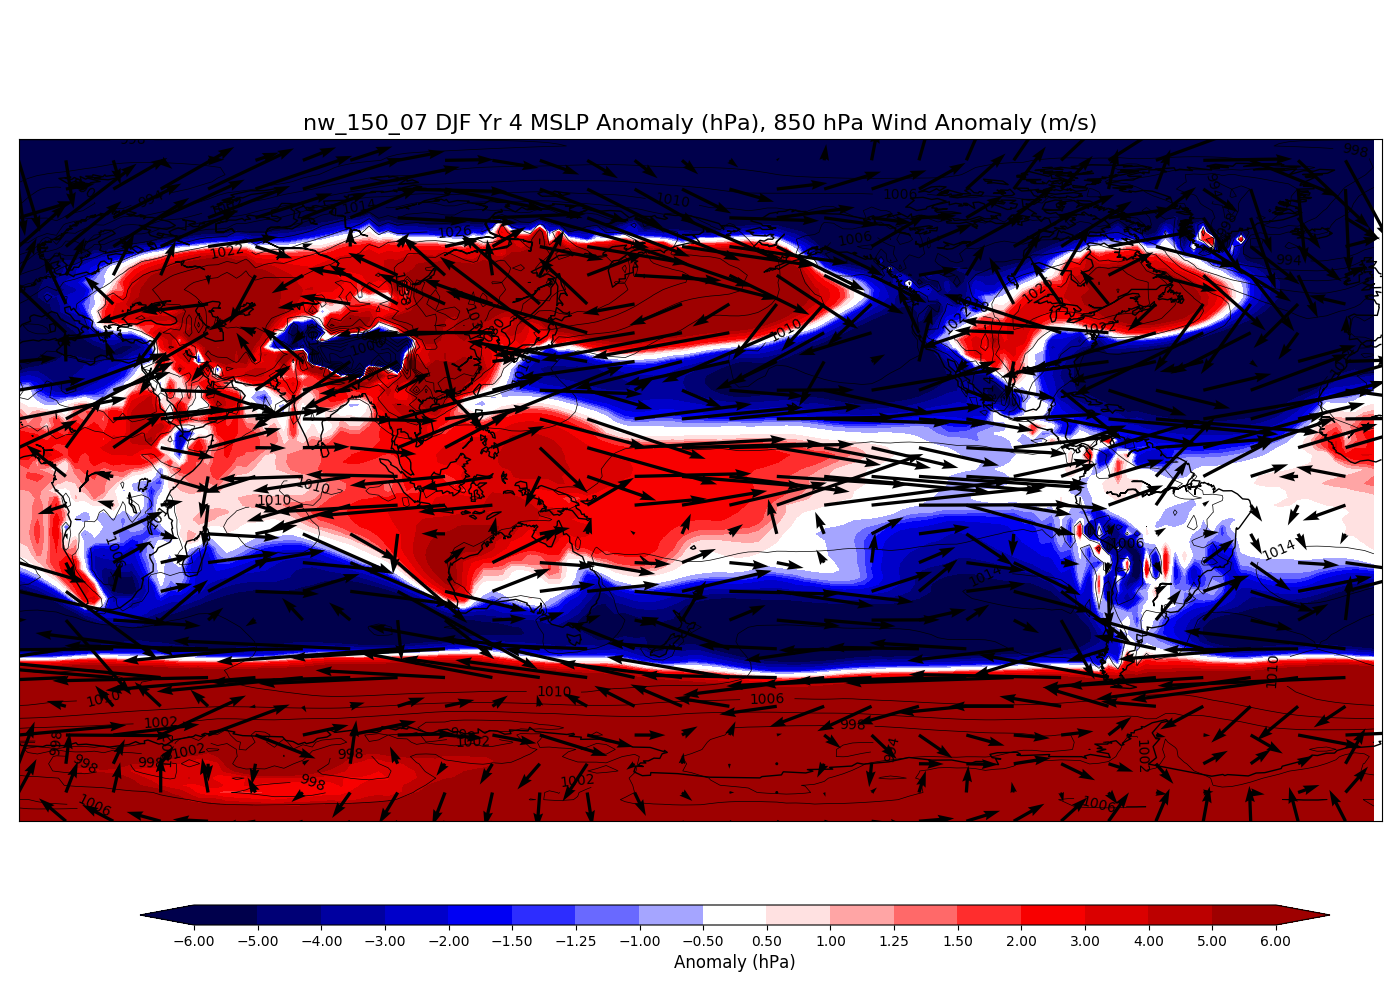
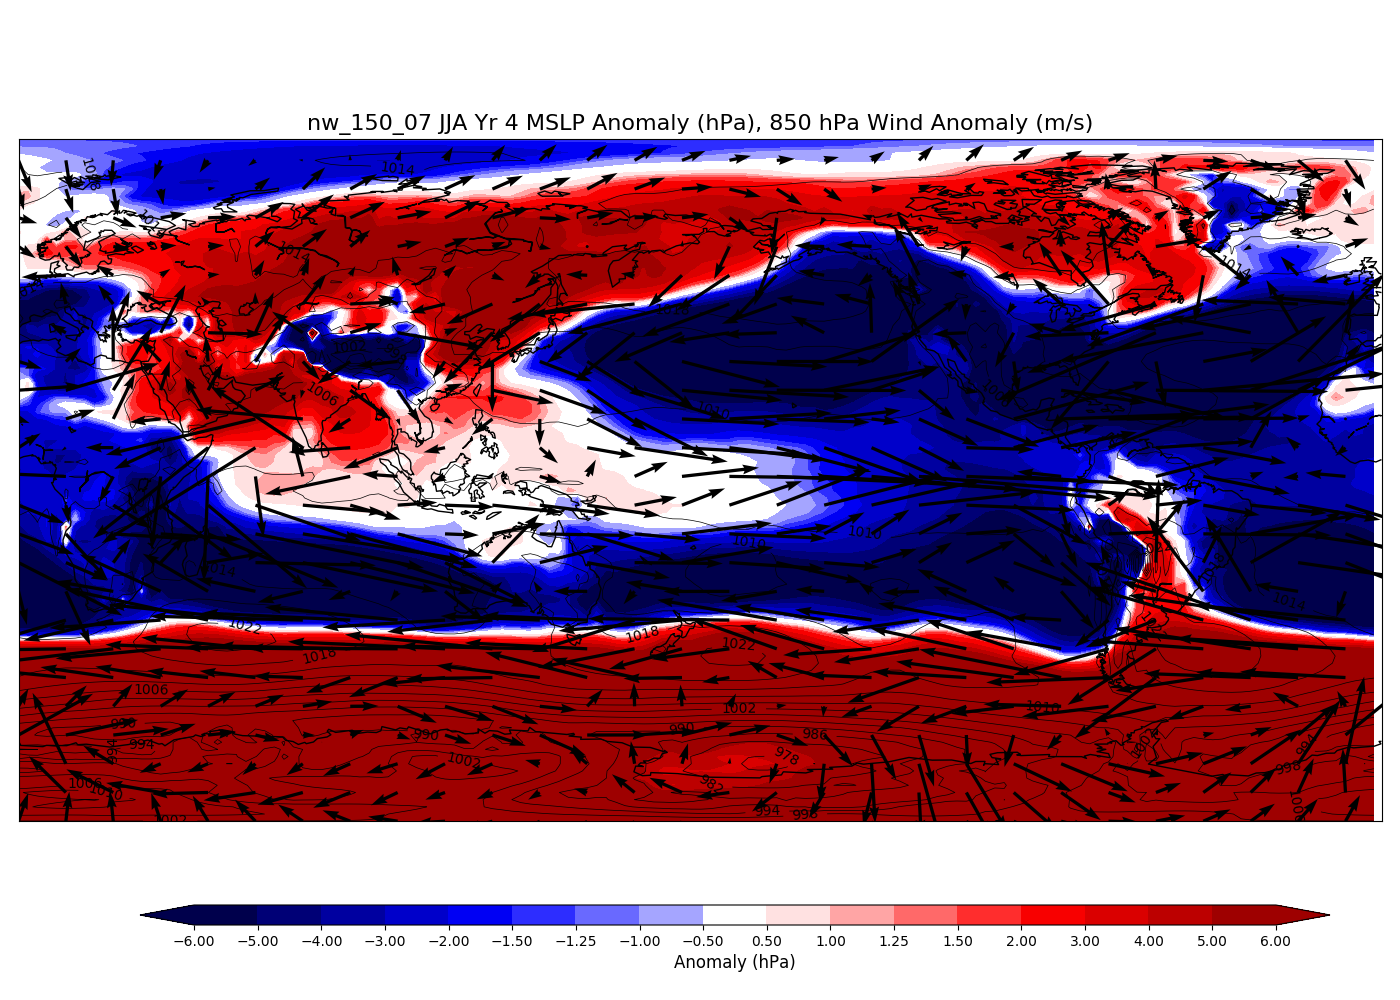
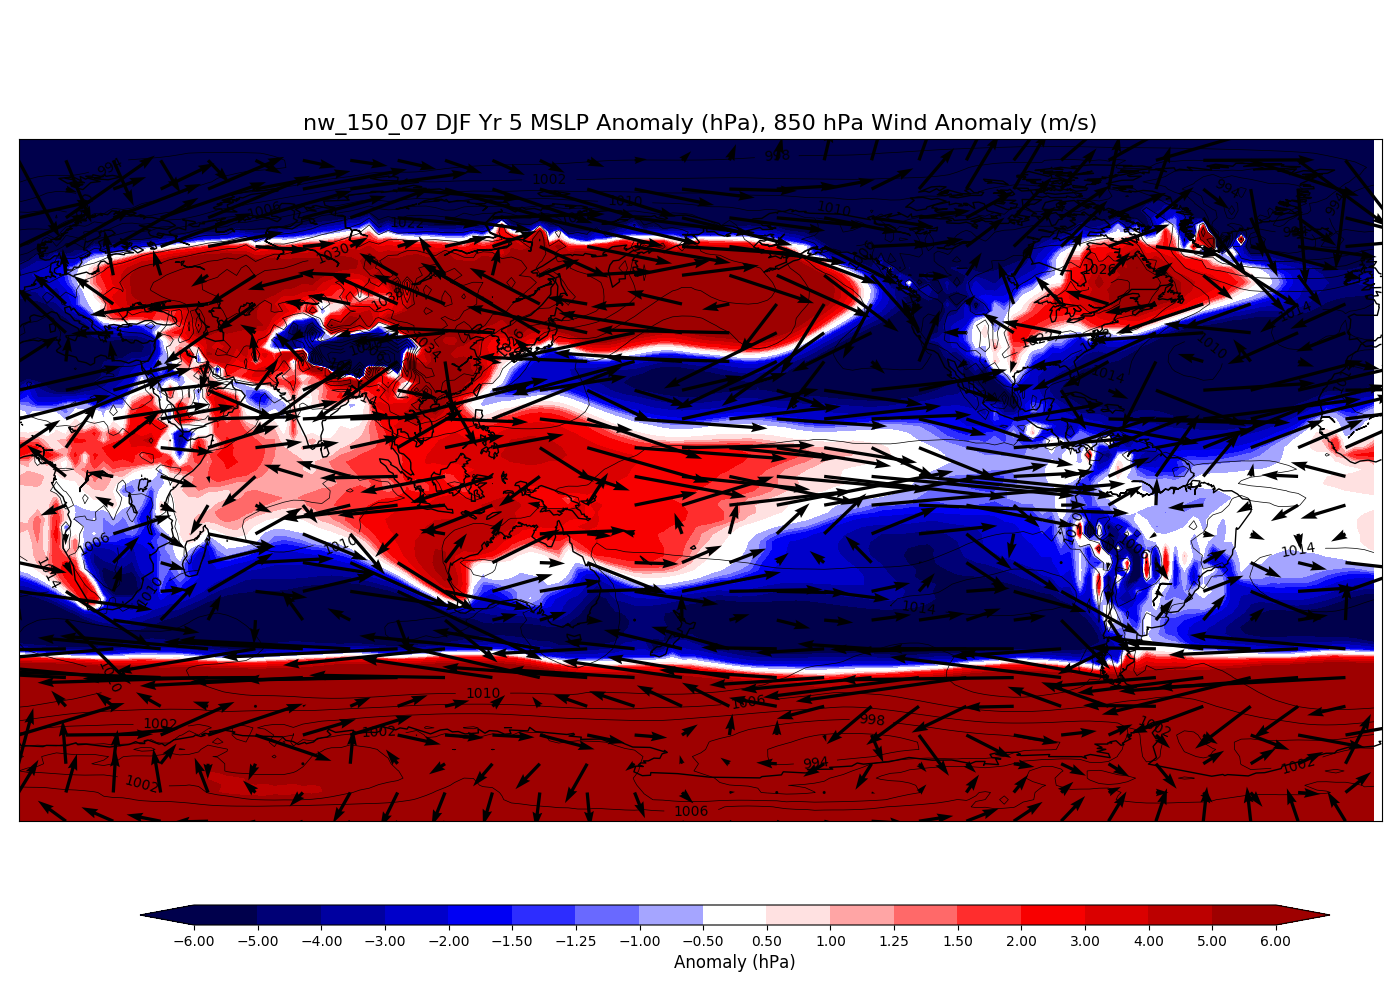
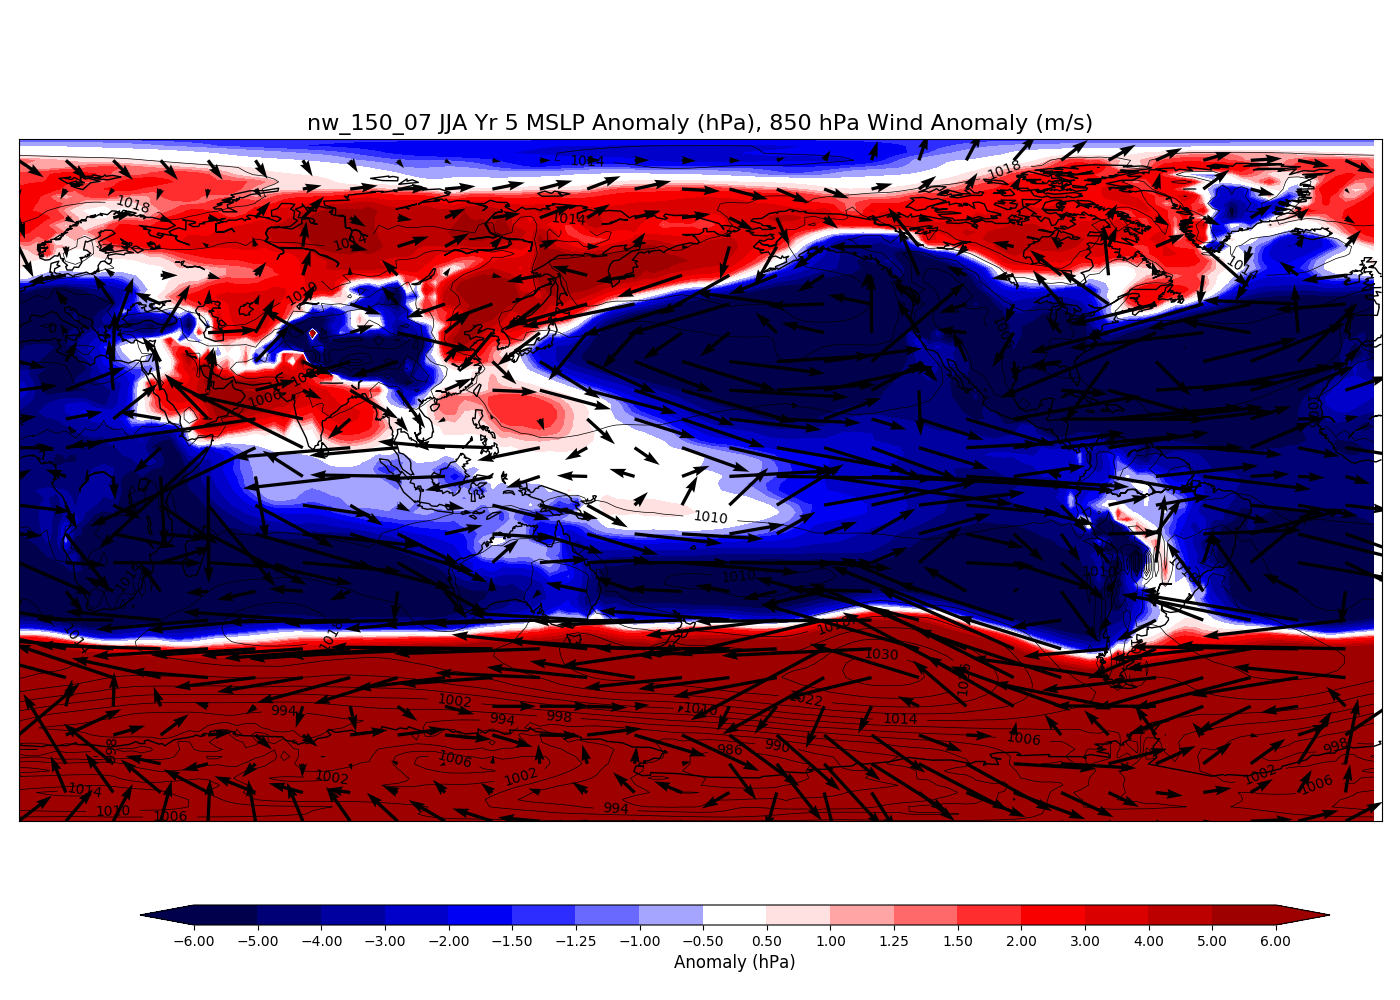
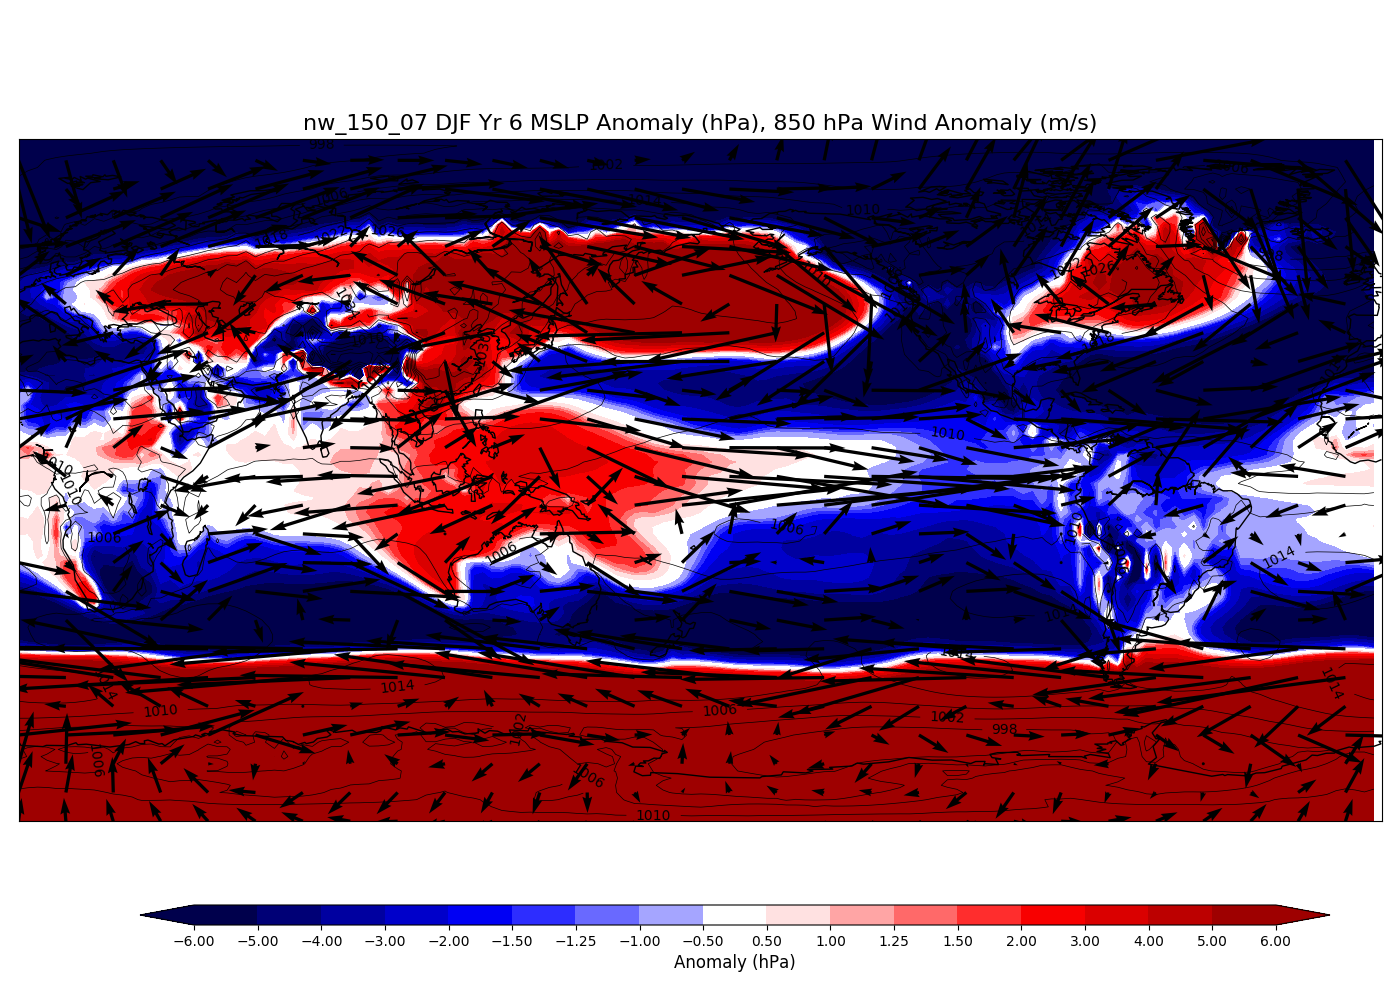
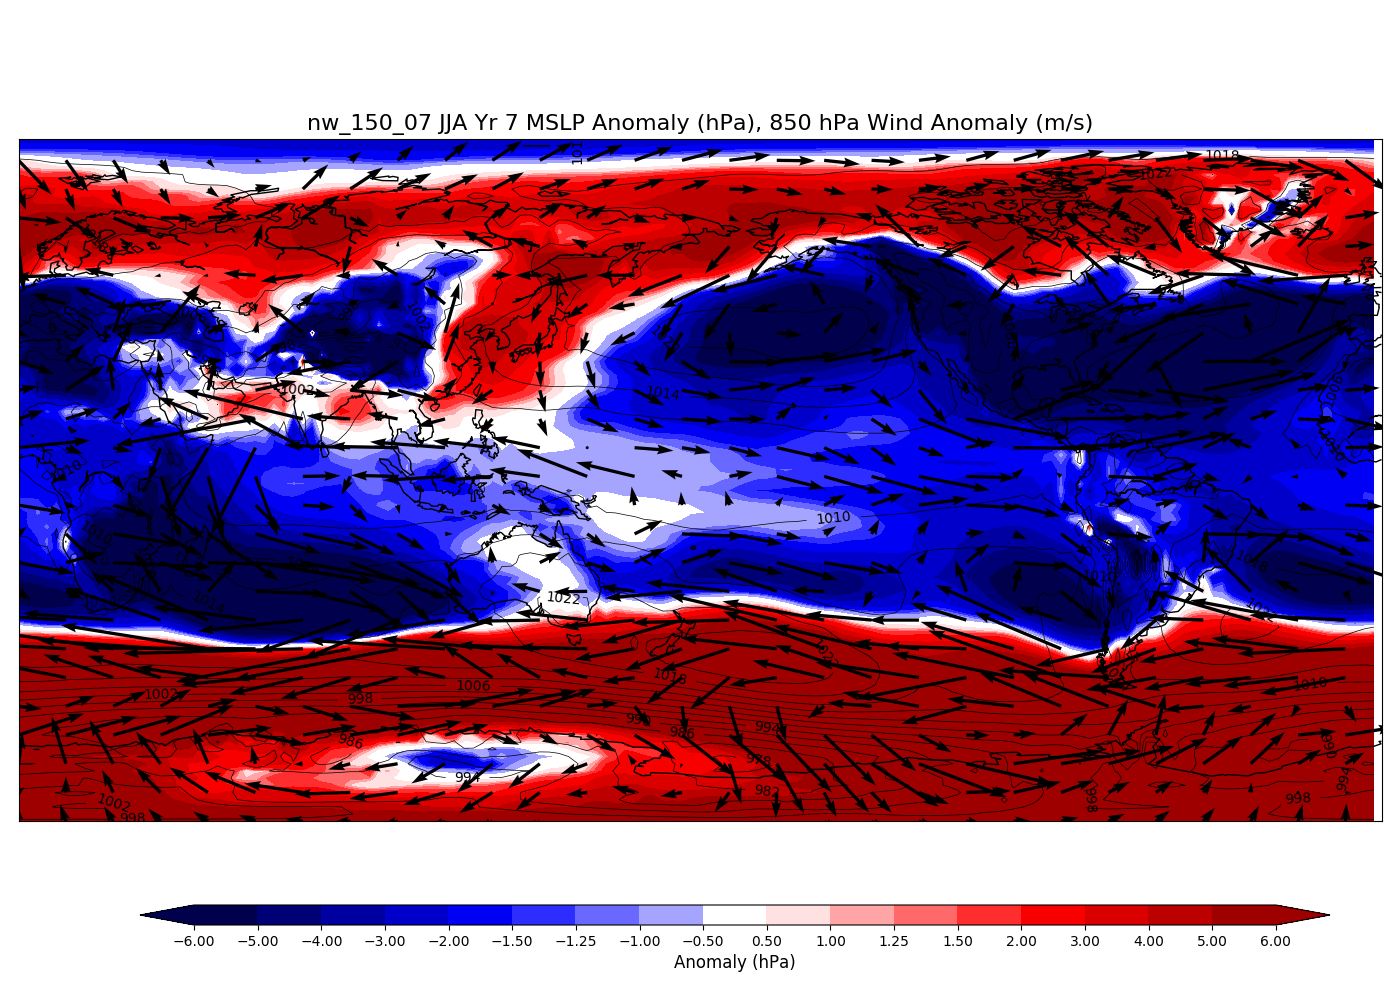
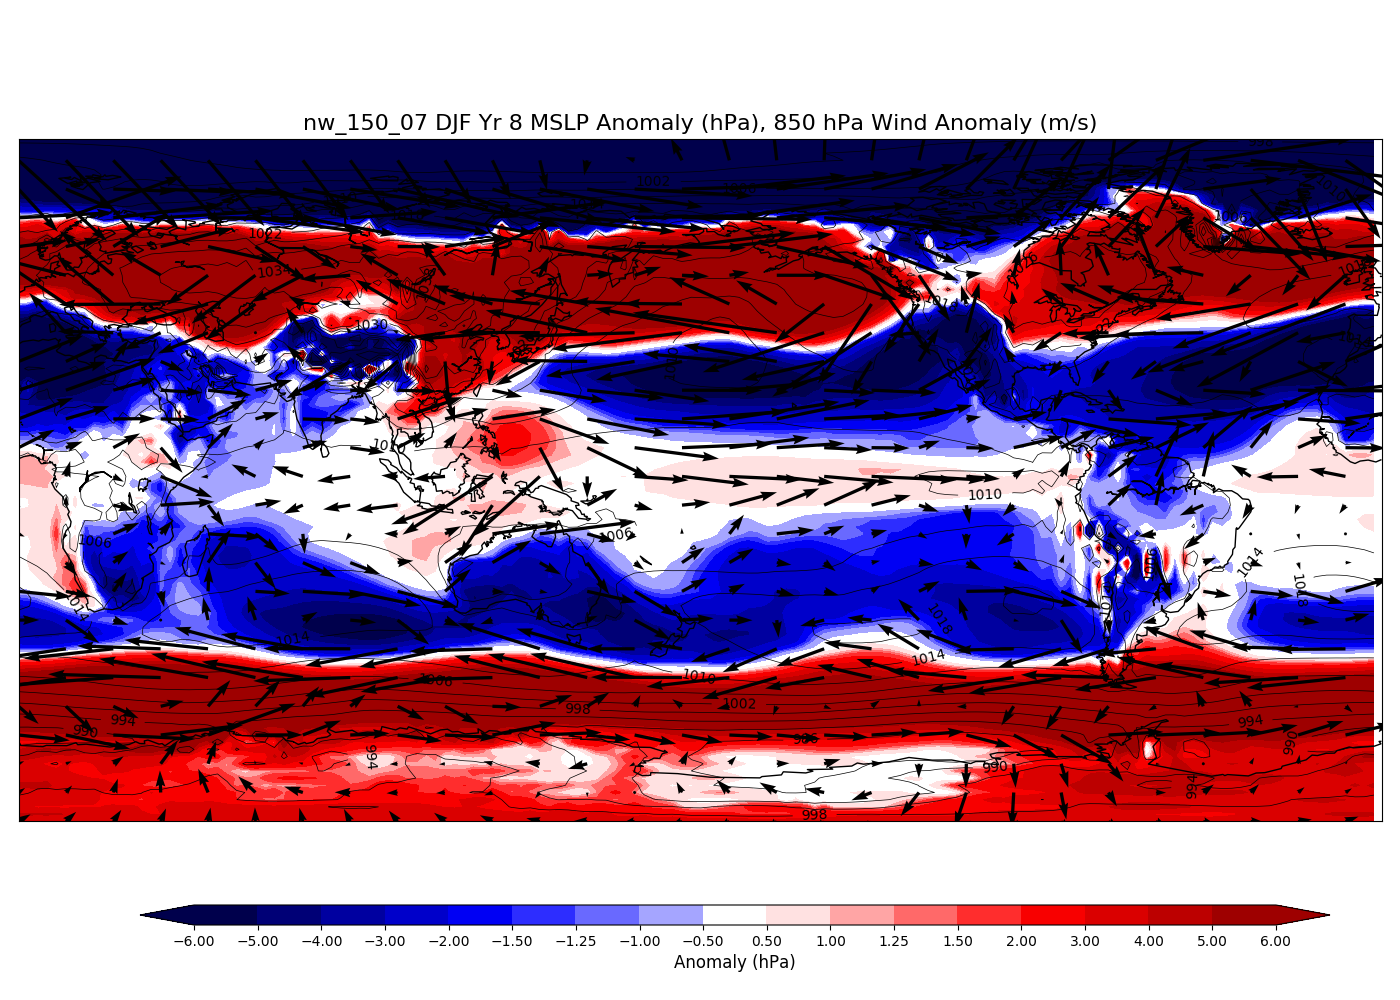
Mean Sea Level Pressure and 850 hPa Wind Anomaly following May 15th 150 Tg injection of soot:
JJA Year 0(left) and DJF Year 1(right)
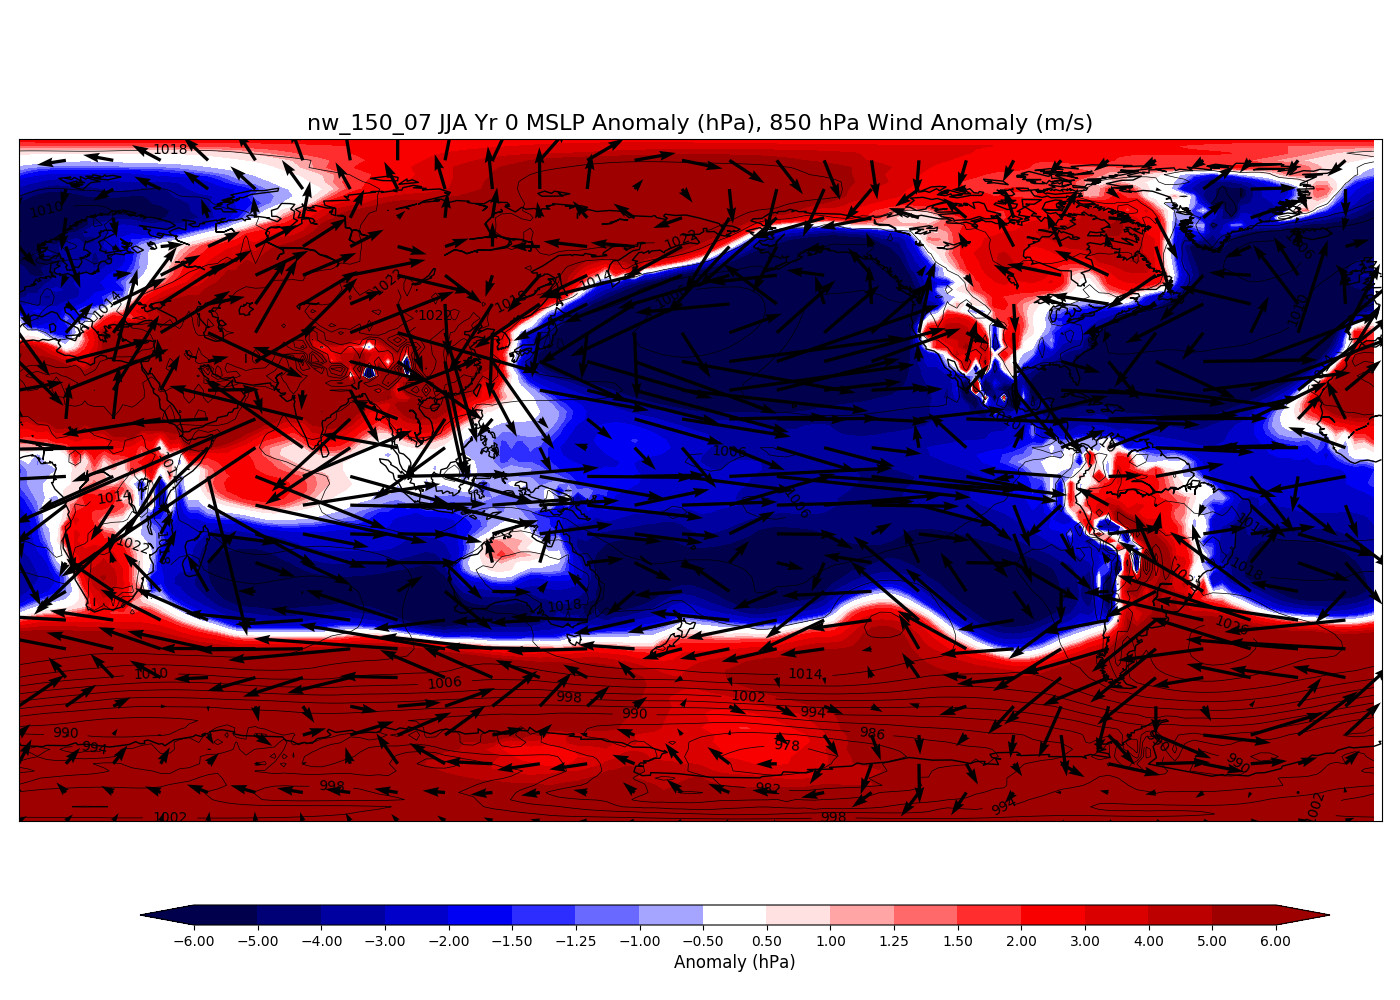
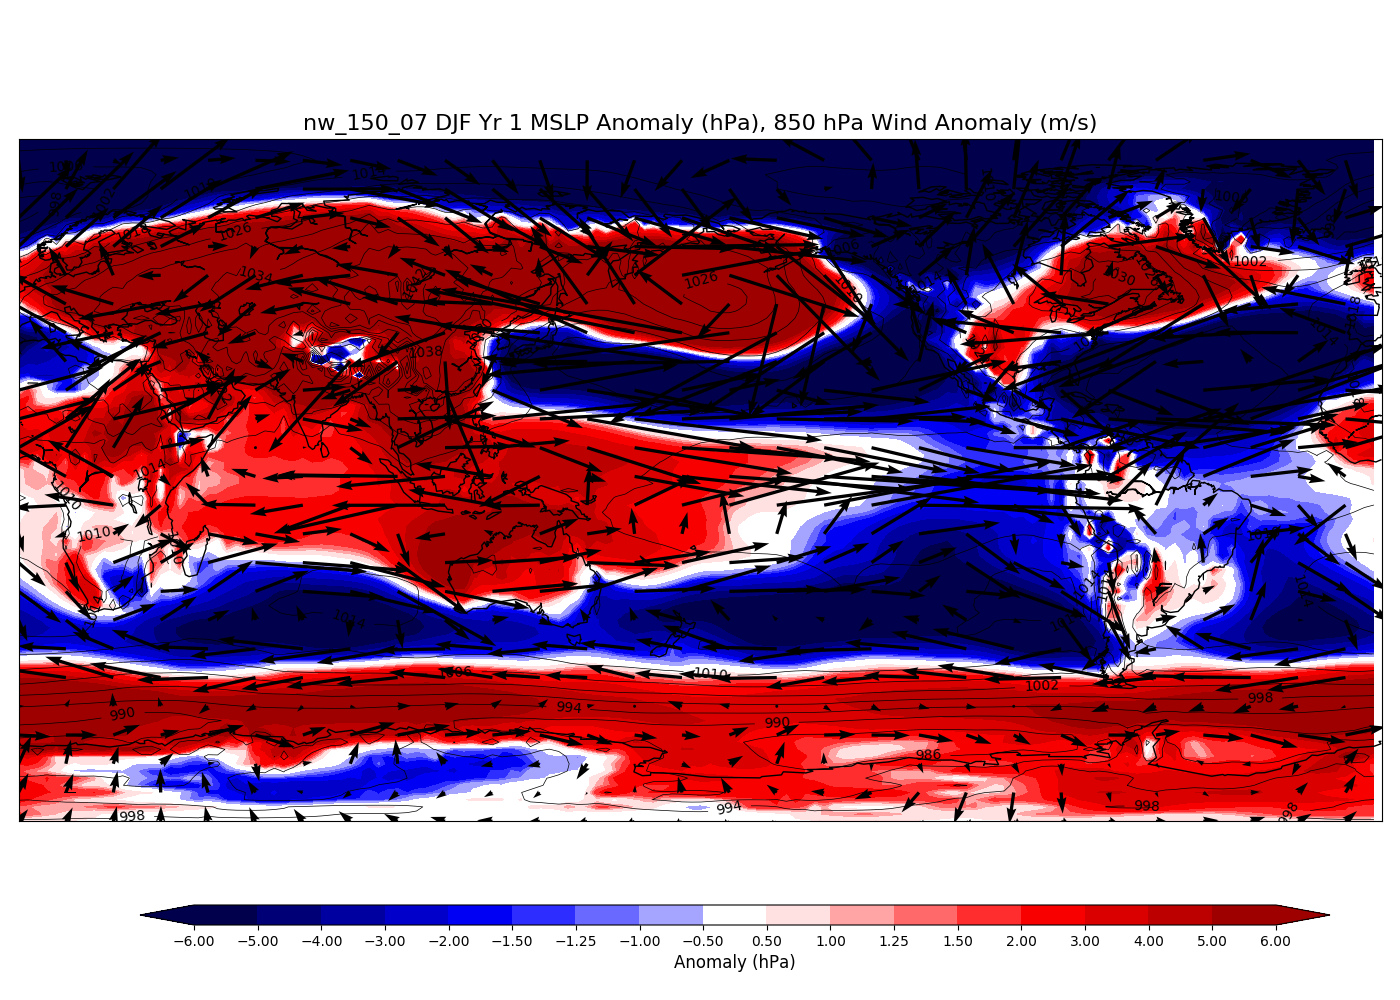
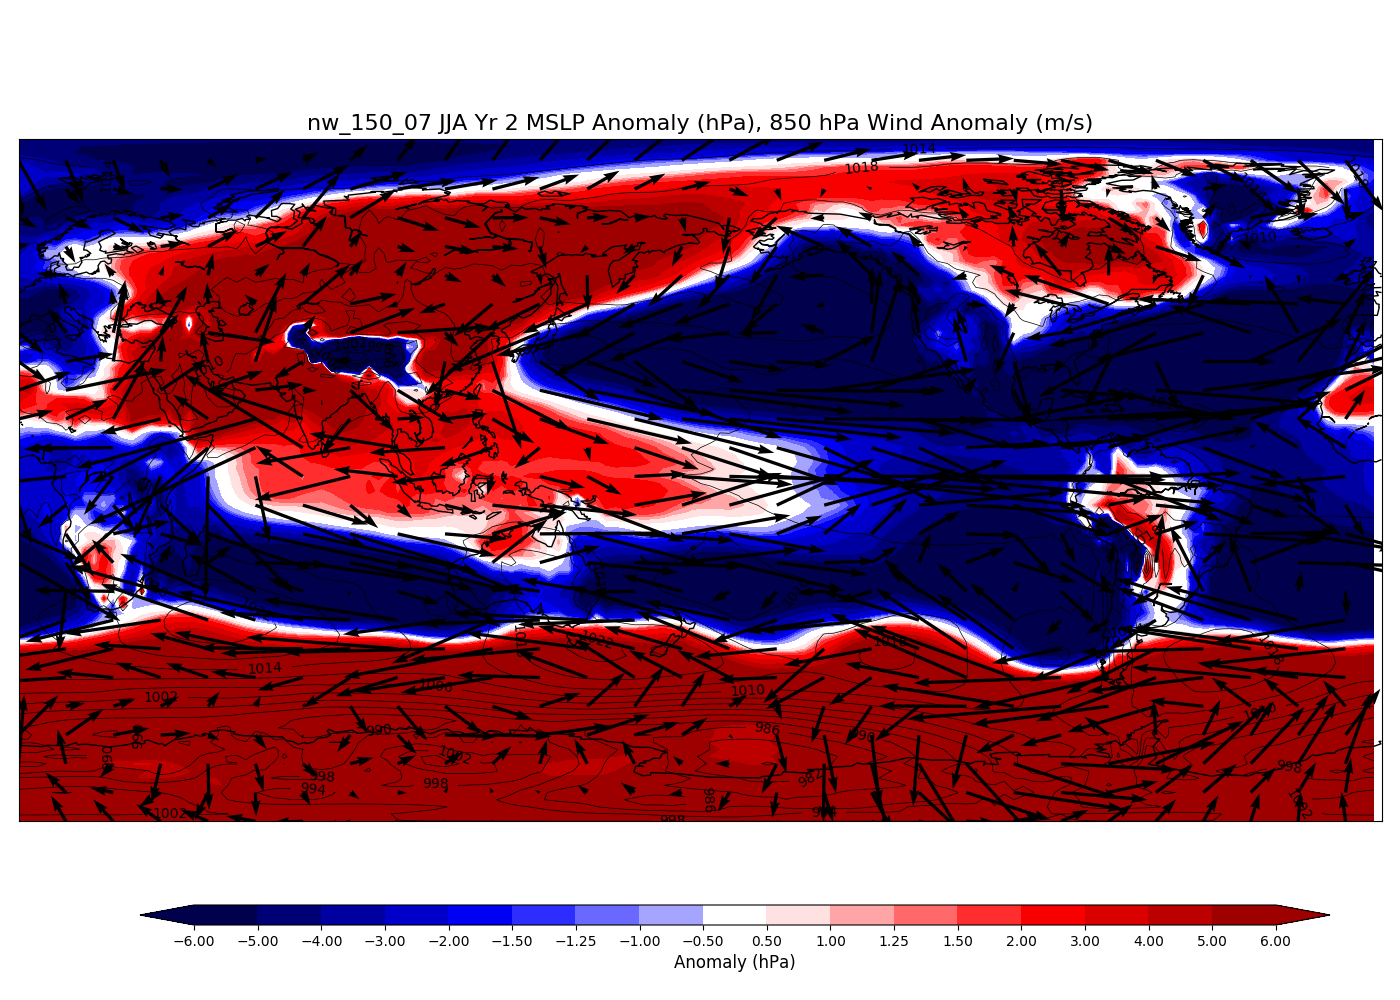
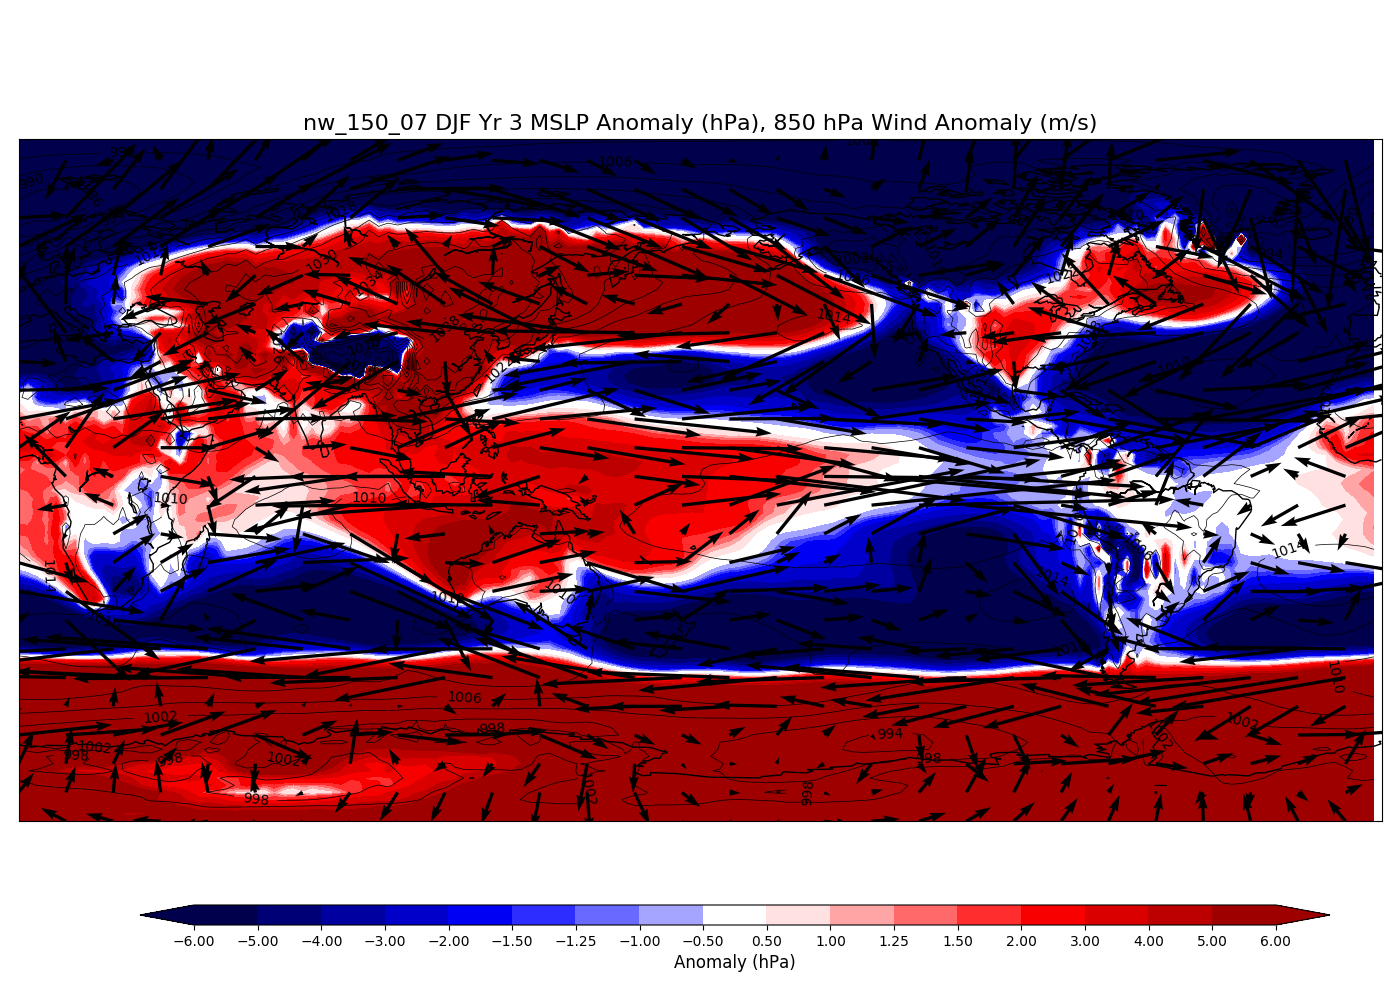
It's clear that there are anomalous westerly winds as soon as 150 Tg of soot is injected into the upper troposphere and stratosphere. These winds are far stronger than in the control composite El Nino figures. The ultimate question is why. The MSLP anomalies are also far greater than during the control El Nino composites, across entire ocean basins. The entirety of eastern Asia is 5+ hPa higher than the control during DJF.
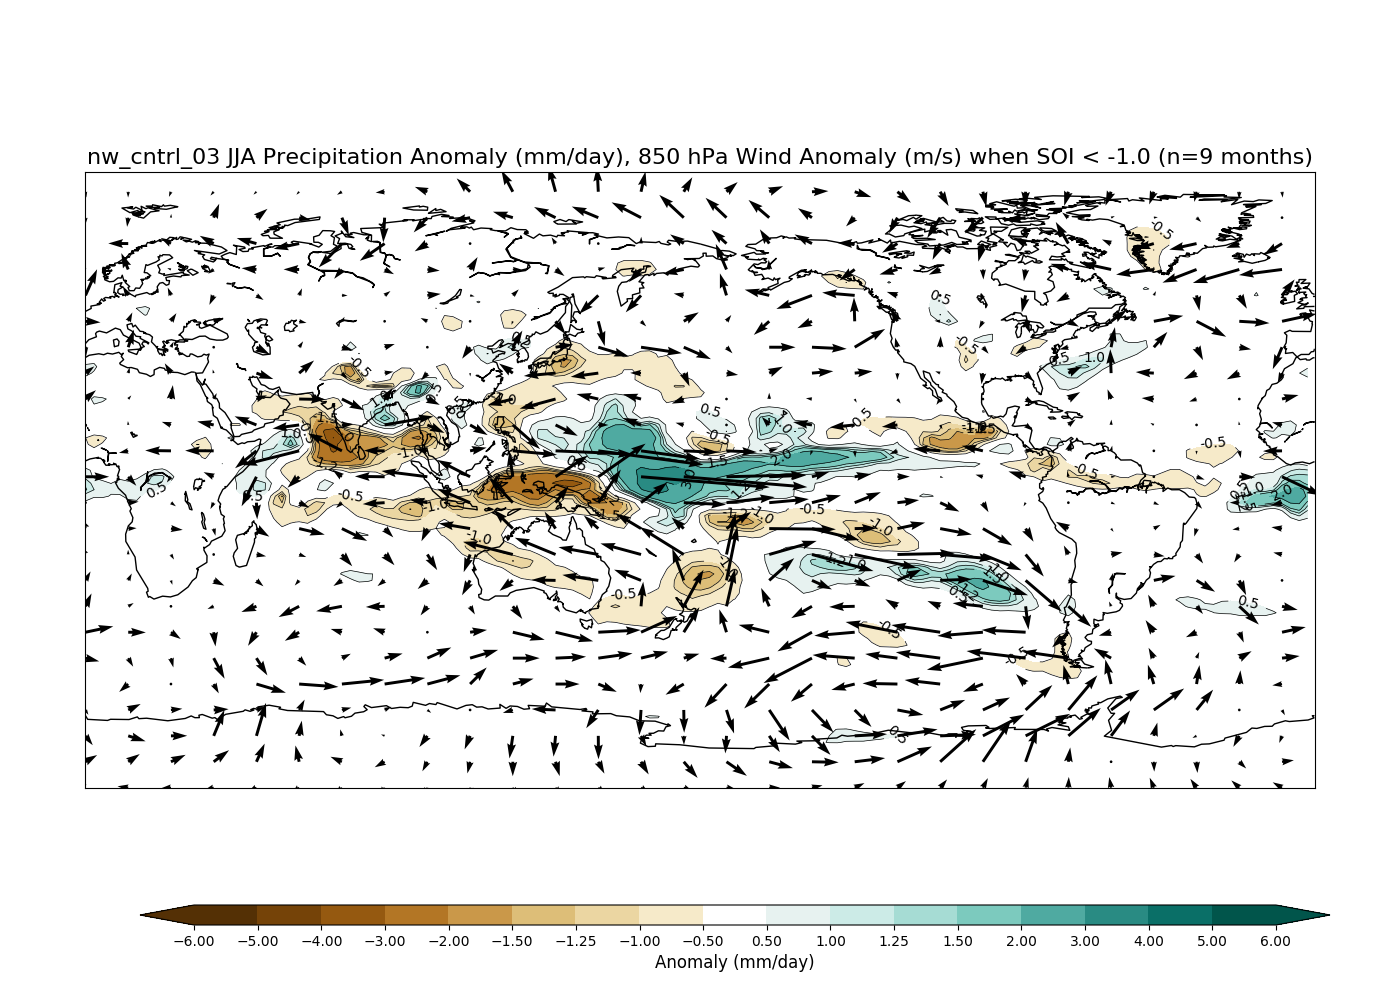
!!!!!!!!! precipitation !!!!!!!!!!
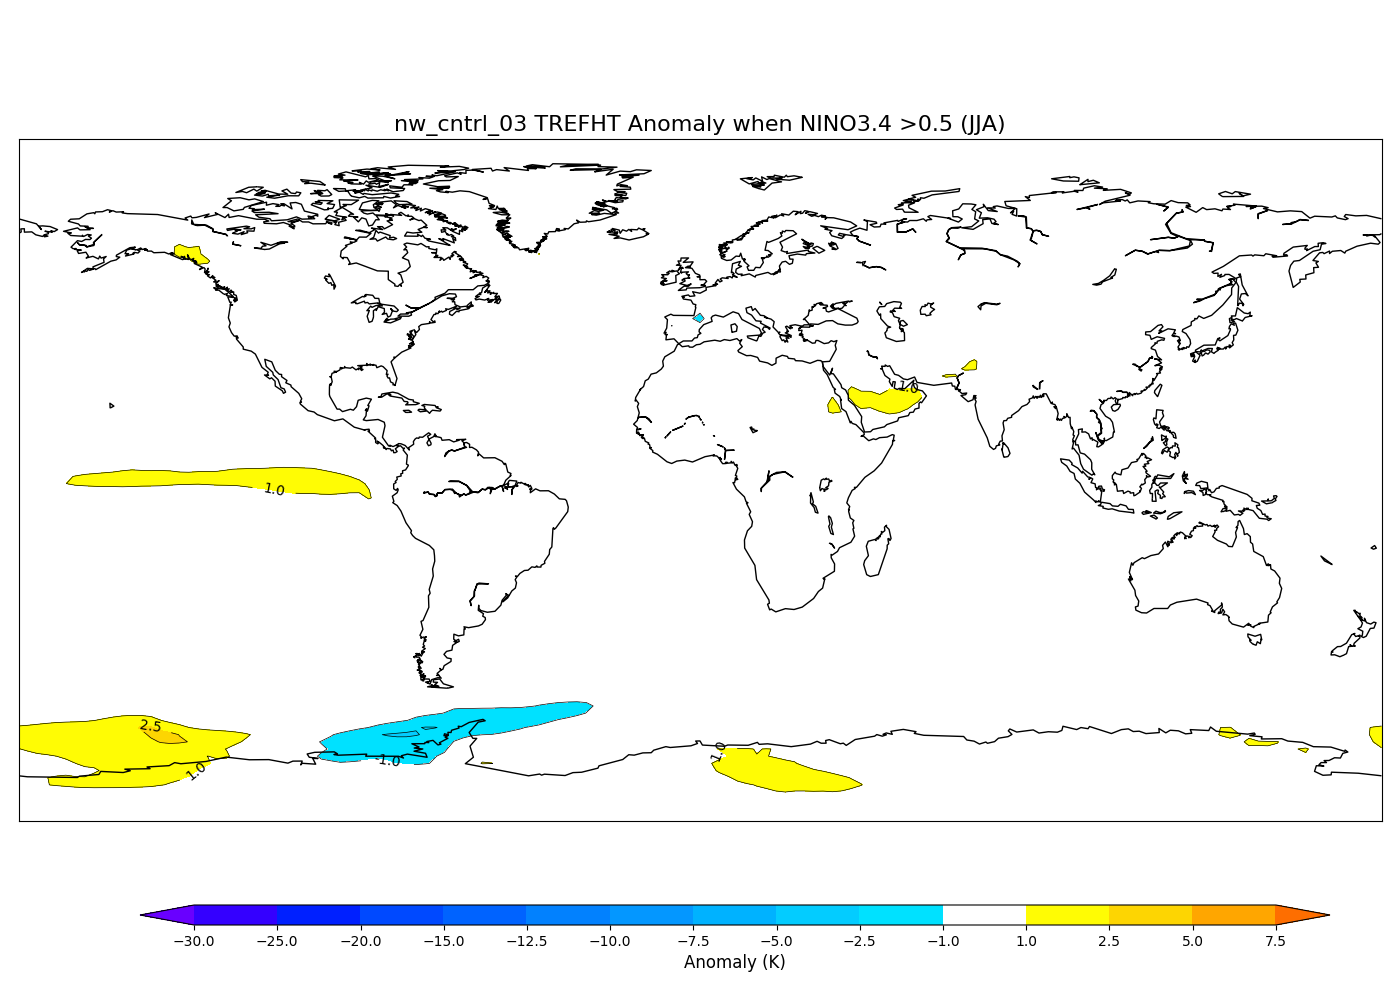
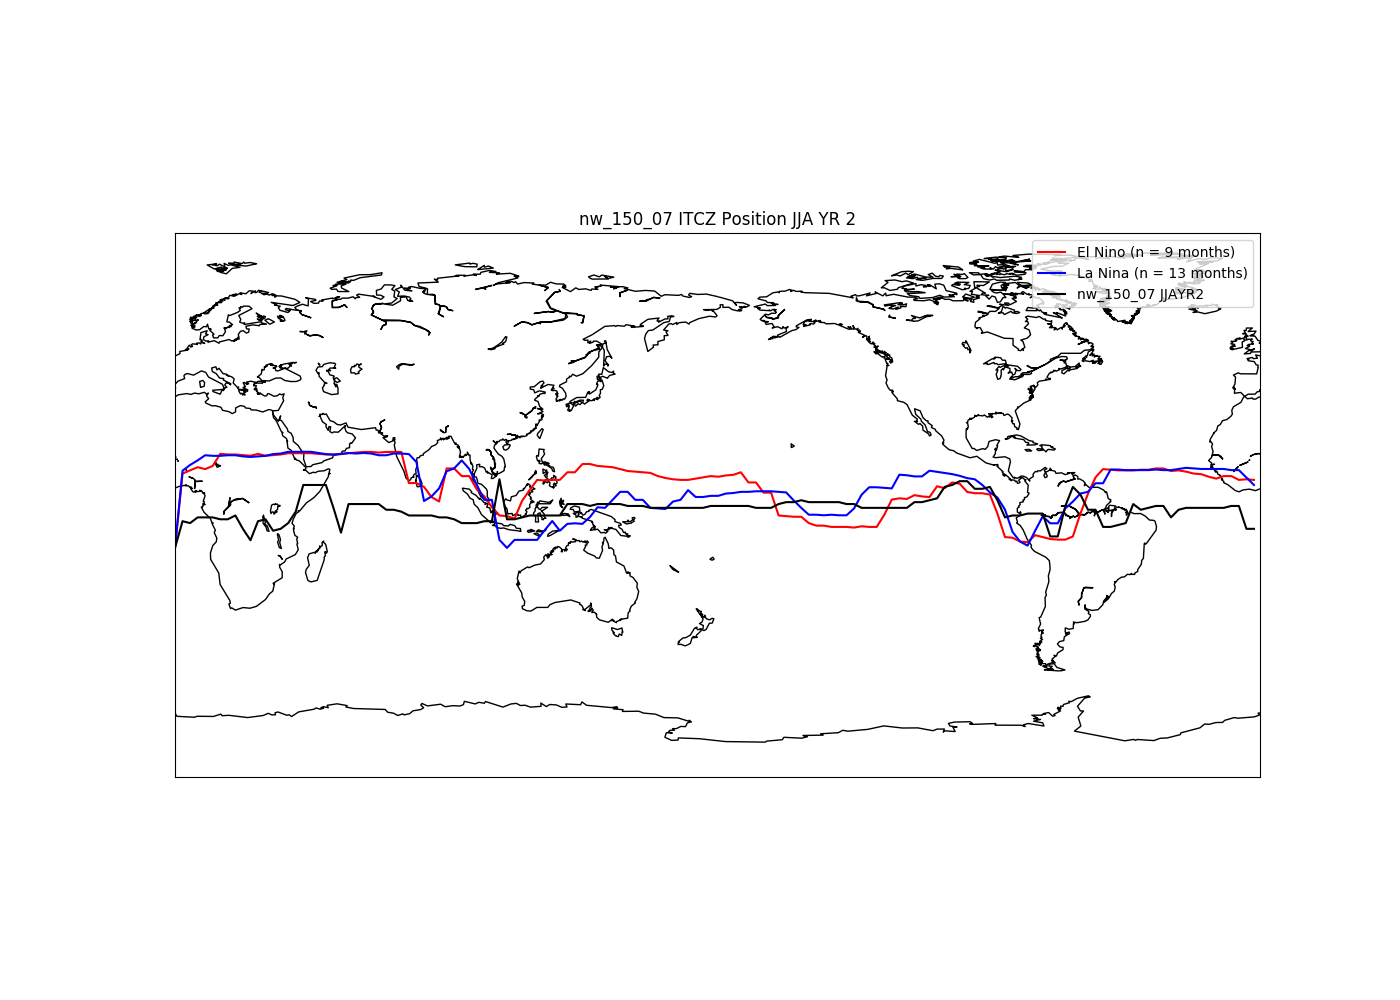
Next, we analyze El Nino conditions during JJA (northern hemisphere summer, n = 9 months). There is a less coherent west = dry / east = wet anomaly during the JJA likely because of changes to the Asian monsoon or the northern position of the ITCZ.
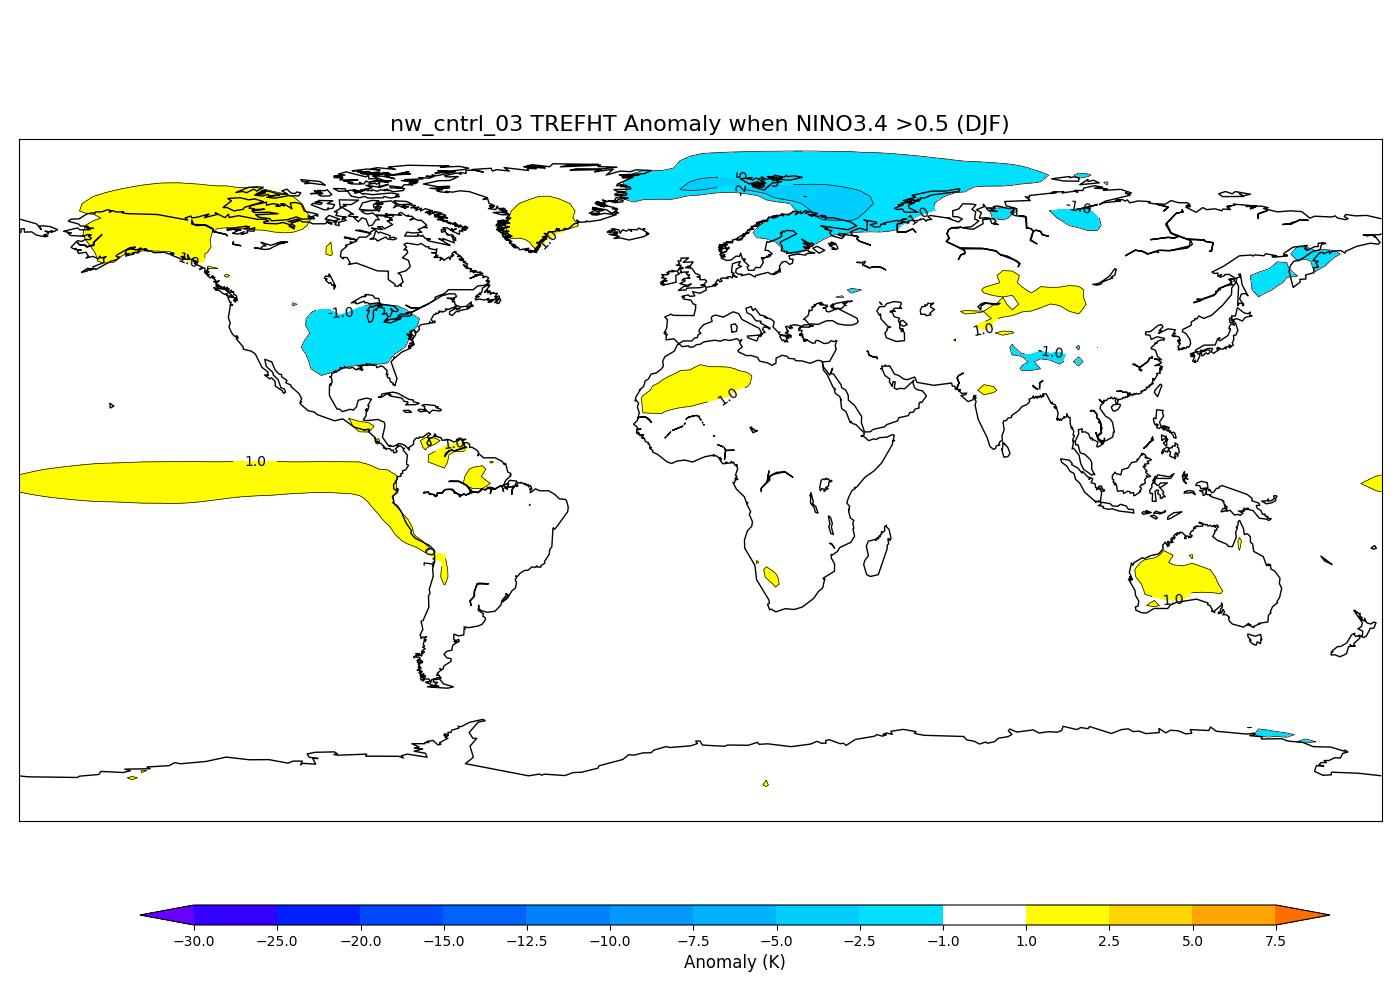
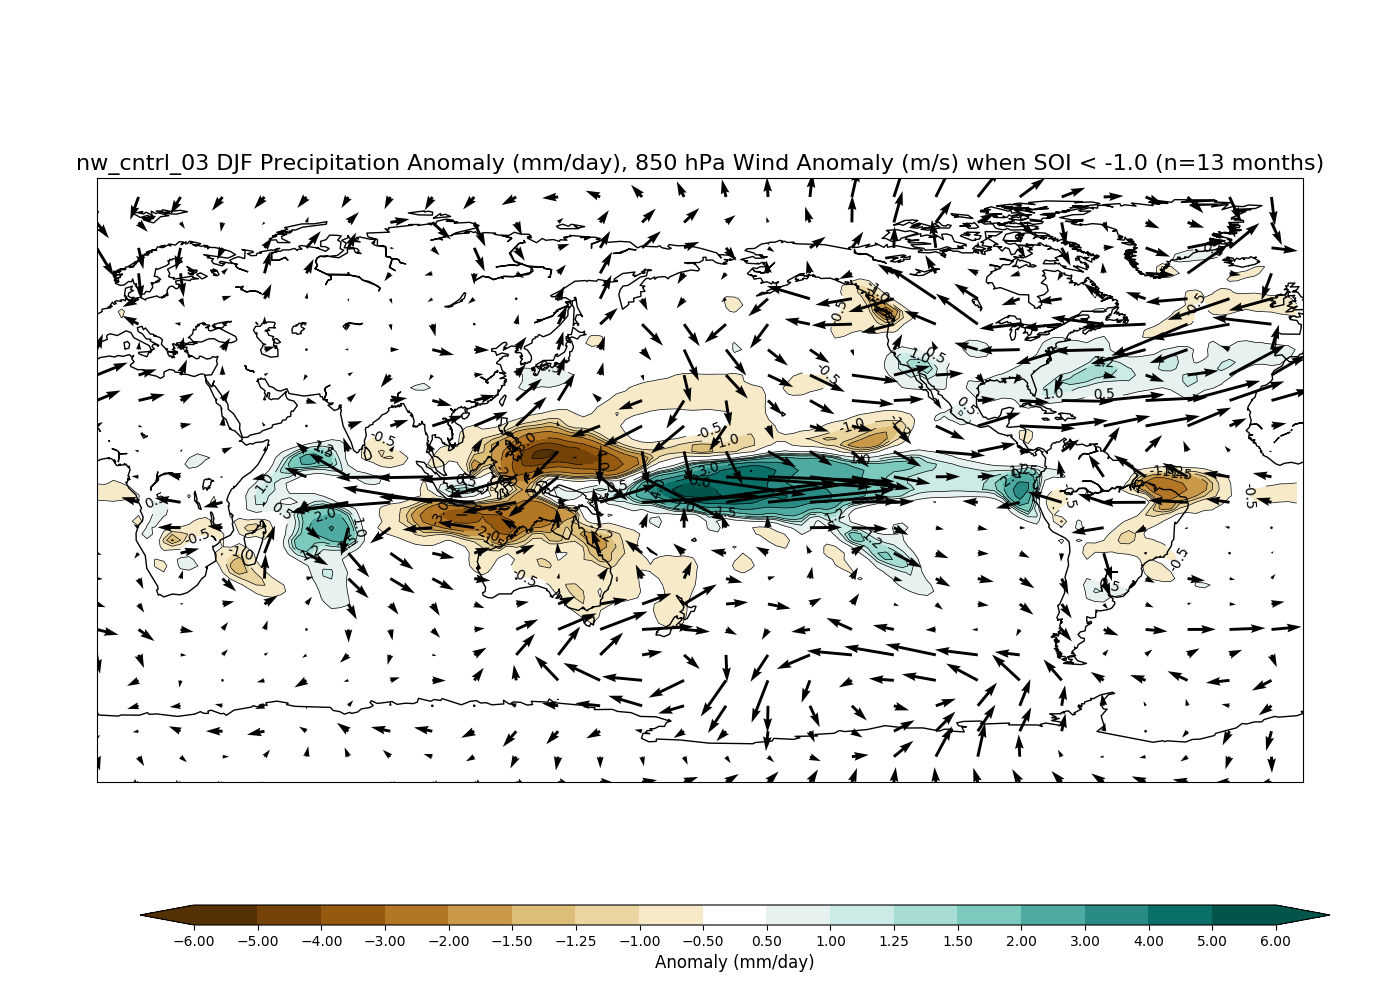
El Nino conditions during DJF (northern hemisphere winter, n = 13 months) shows a very strong west/east contrast in precipitation, as well as two maxima in reduced precipitation on either side of the equator.
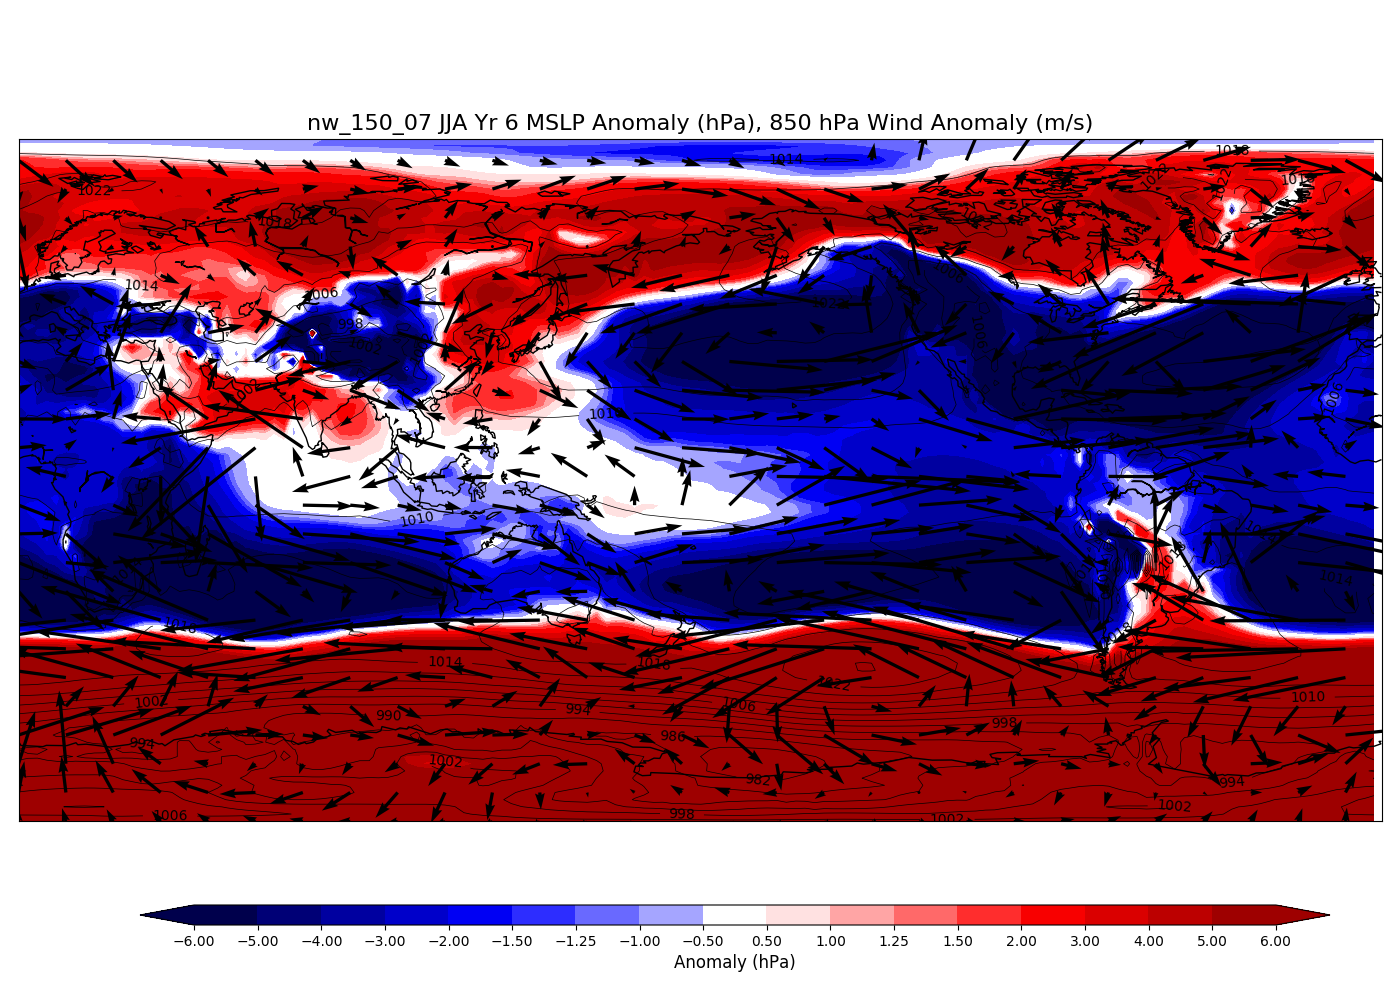
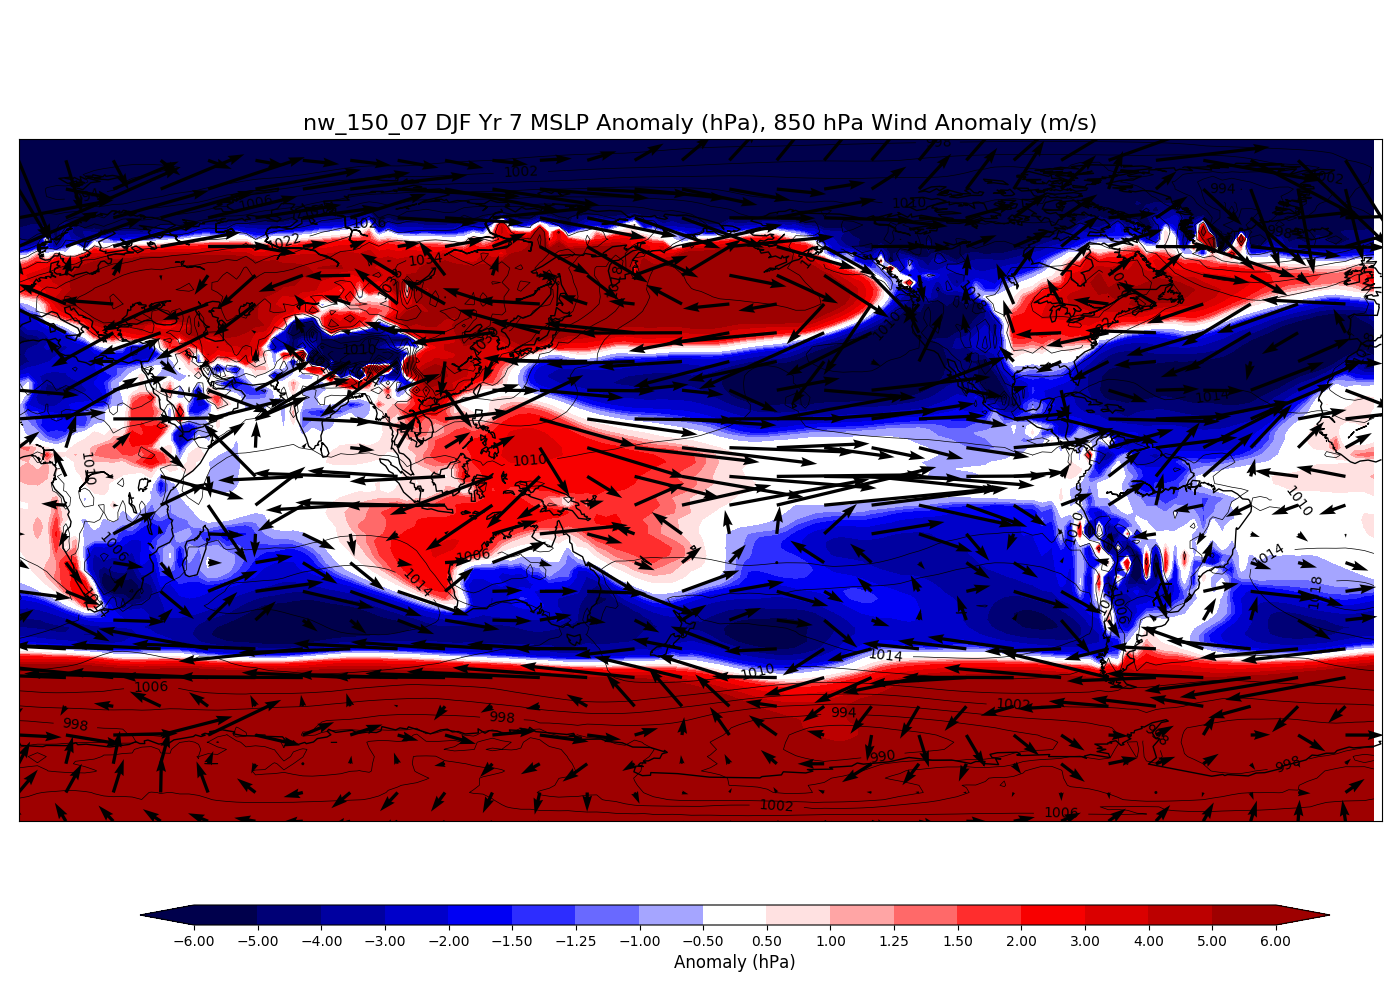
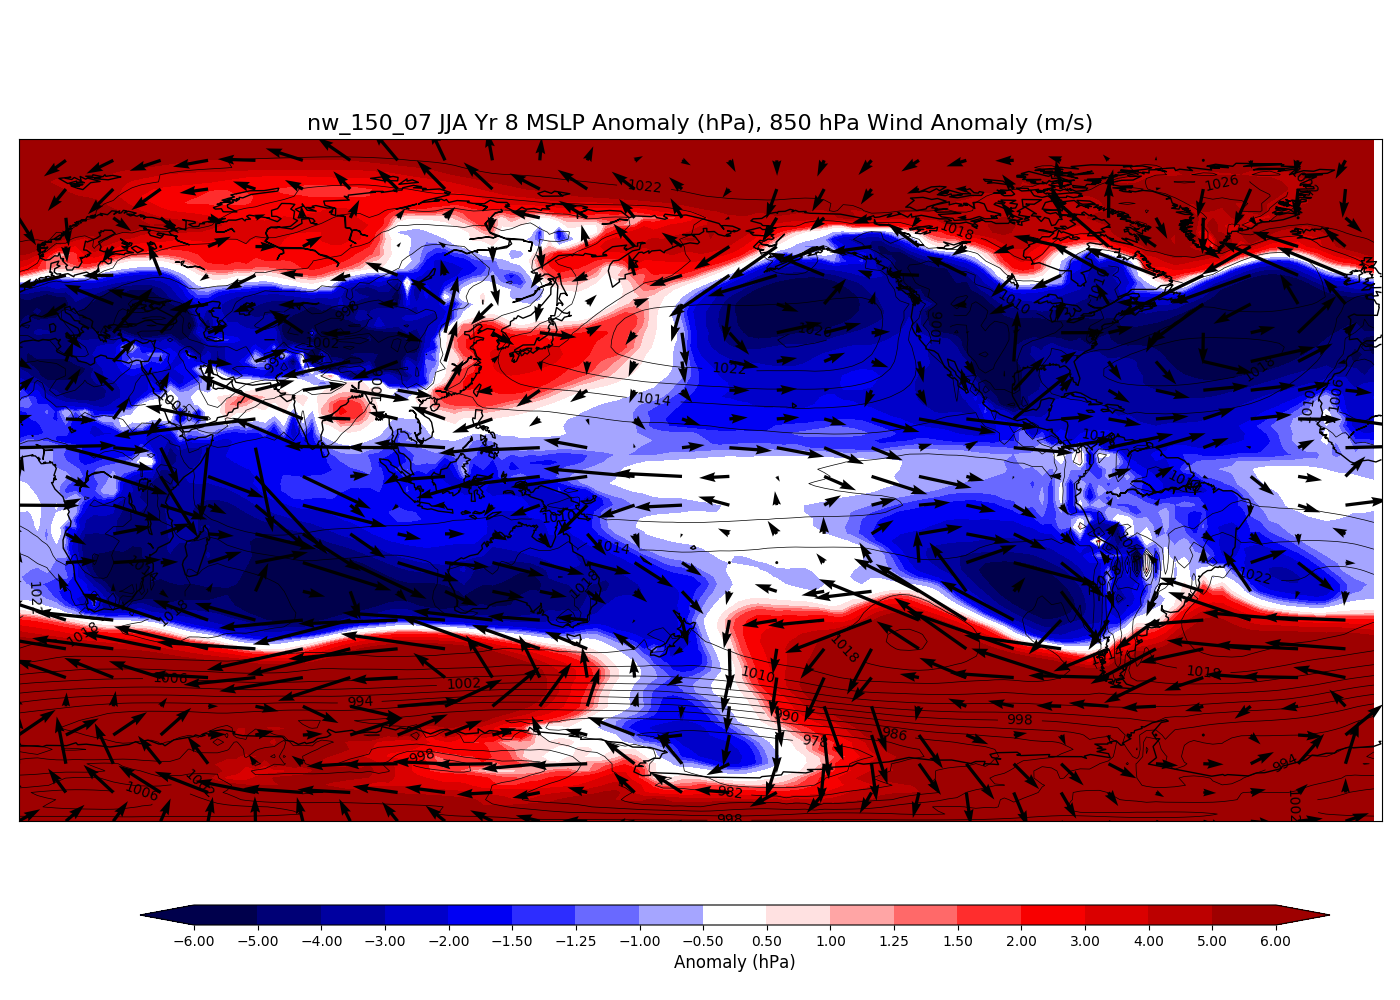
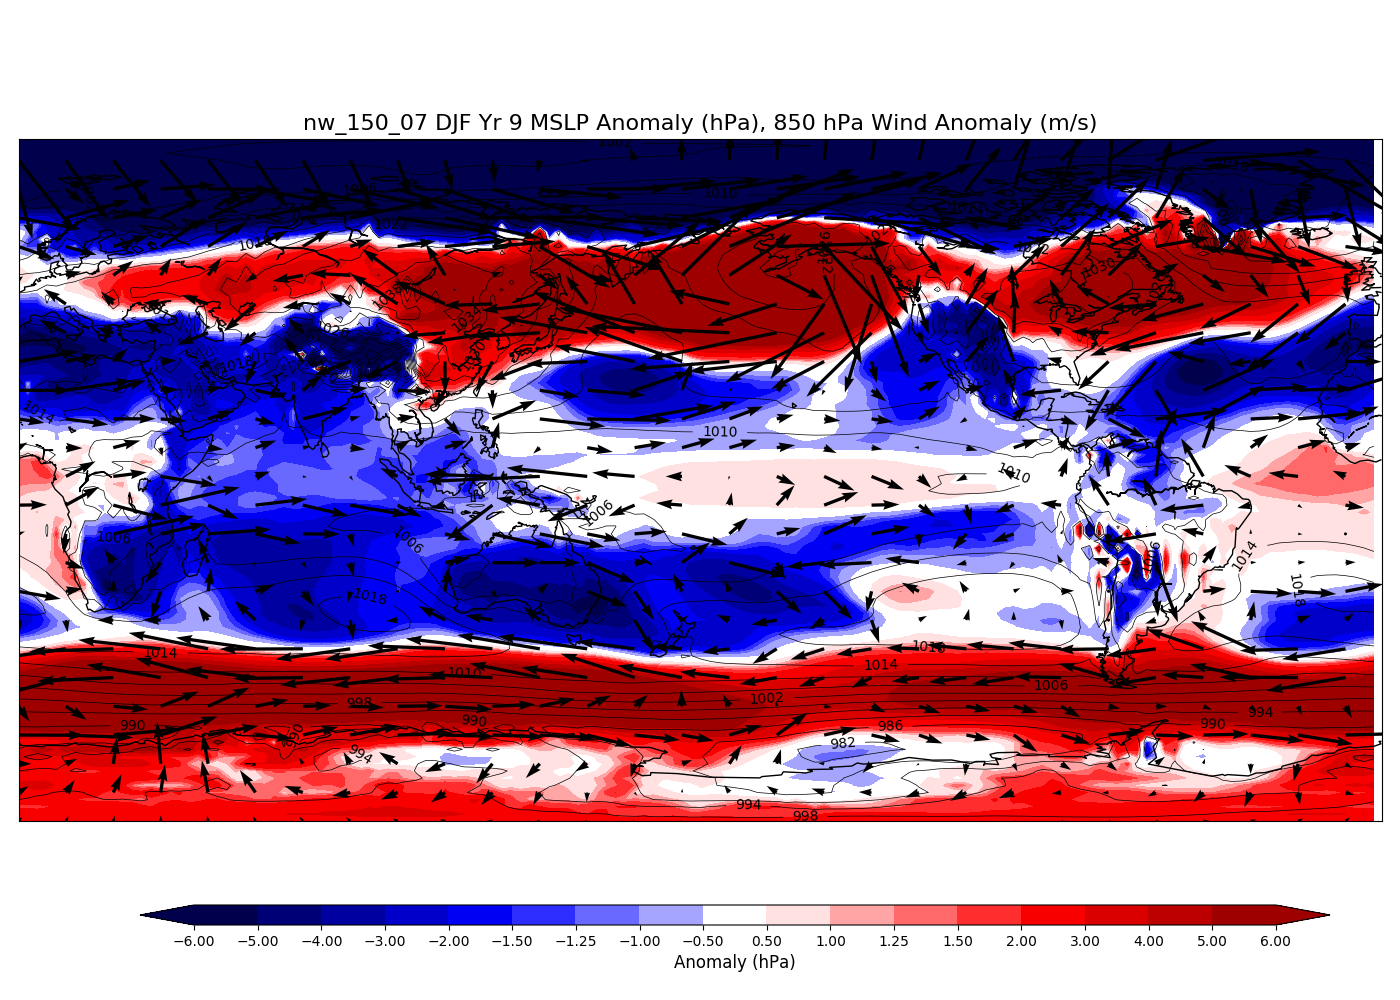
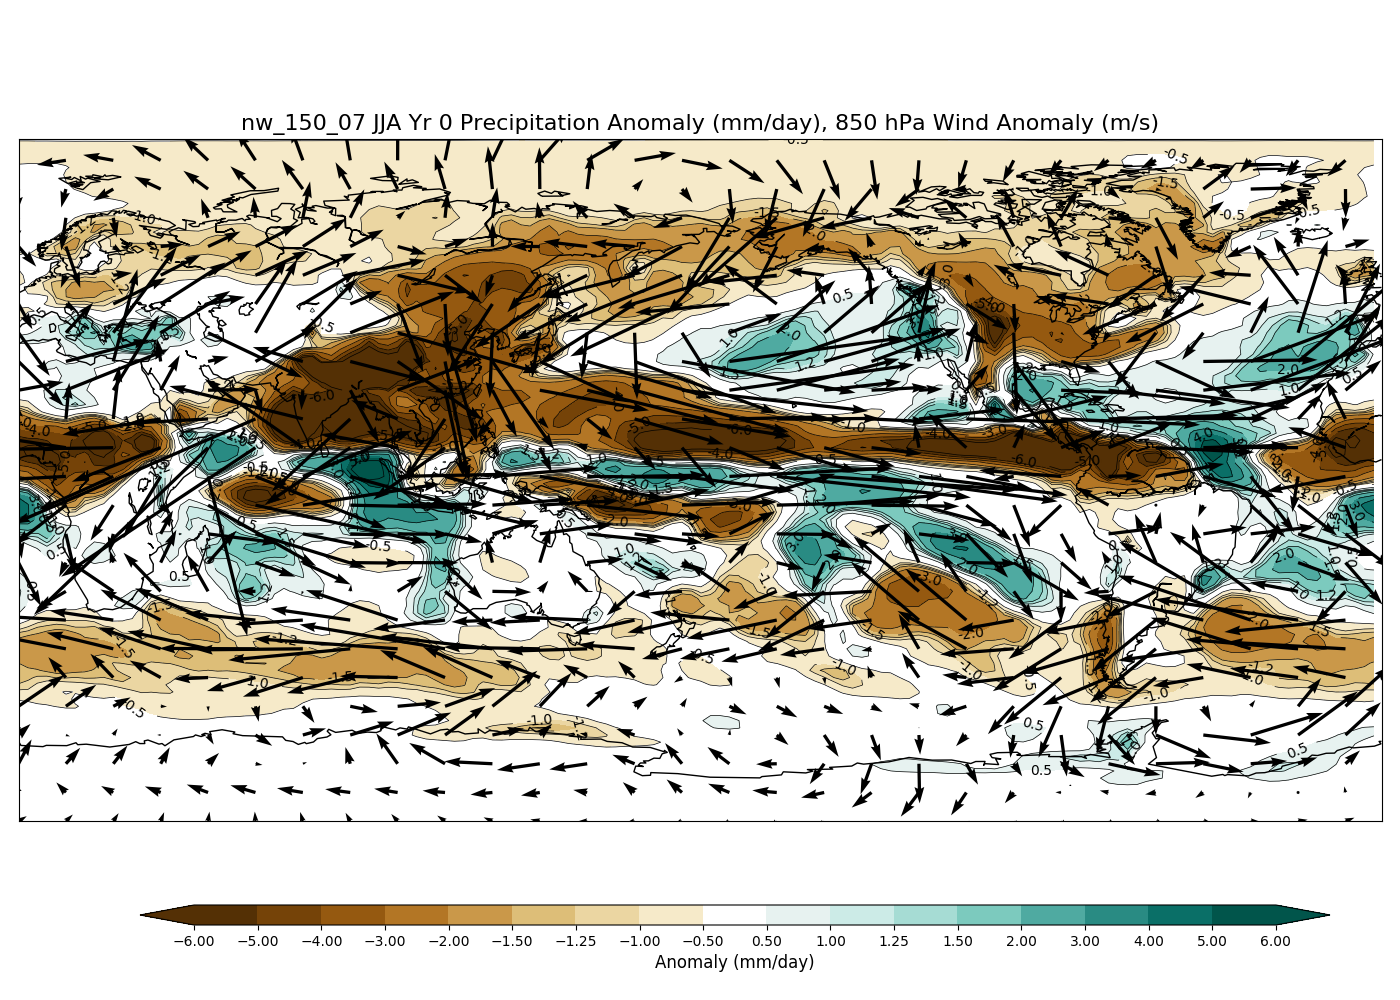
Conditions after 150 Tg black carbon injection
A strong reduction in convection north of the equator is responsible for the very strong negative signal over much of the Pacific Ocean, which is directly driven by a reduction in solar radiation. Strong westerly wind anomalies are observed over these same areas, which triggers an El Nino. These westerly wind anomalies are much further north compared to a classic El Nino.
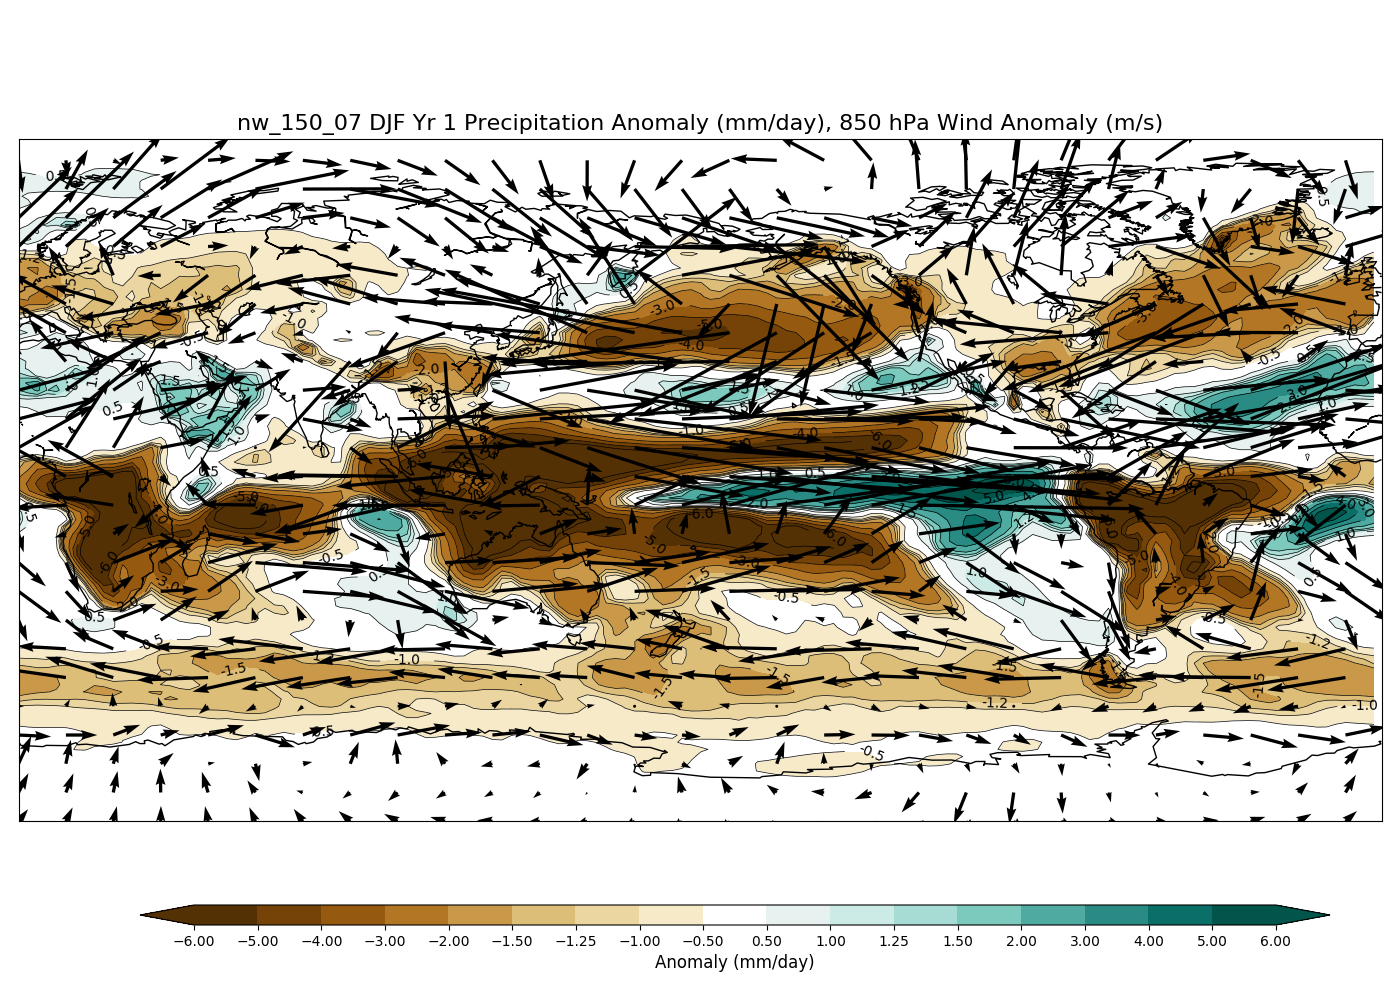
Stronger reductions in precipitation are observed during the first full DJF after the soot injection, but the strength of the El Nino is shown in the enhanced precipitation over the equator. Very strong westerly winds are supporting very strong El Nino conditions.
SOI-based index: (pressure difference between Tahiti and Darwin)
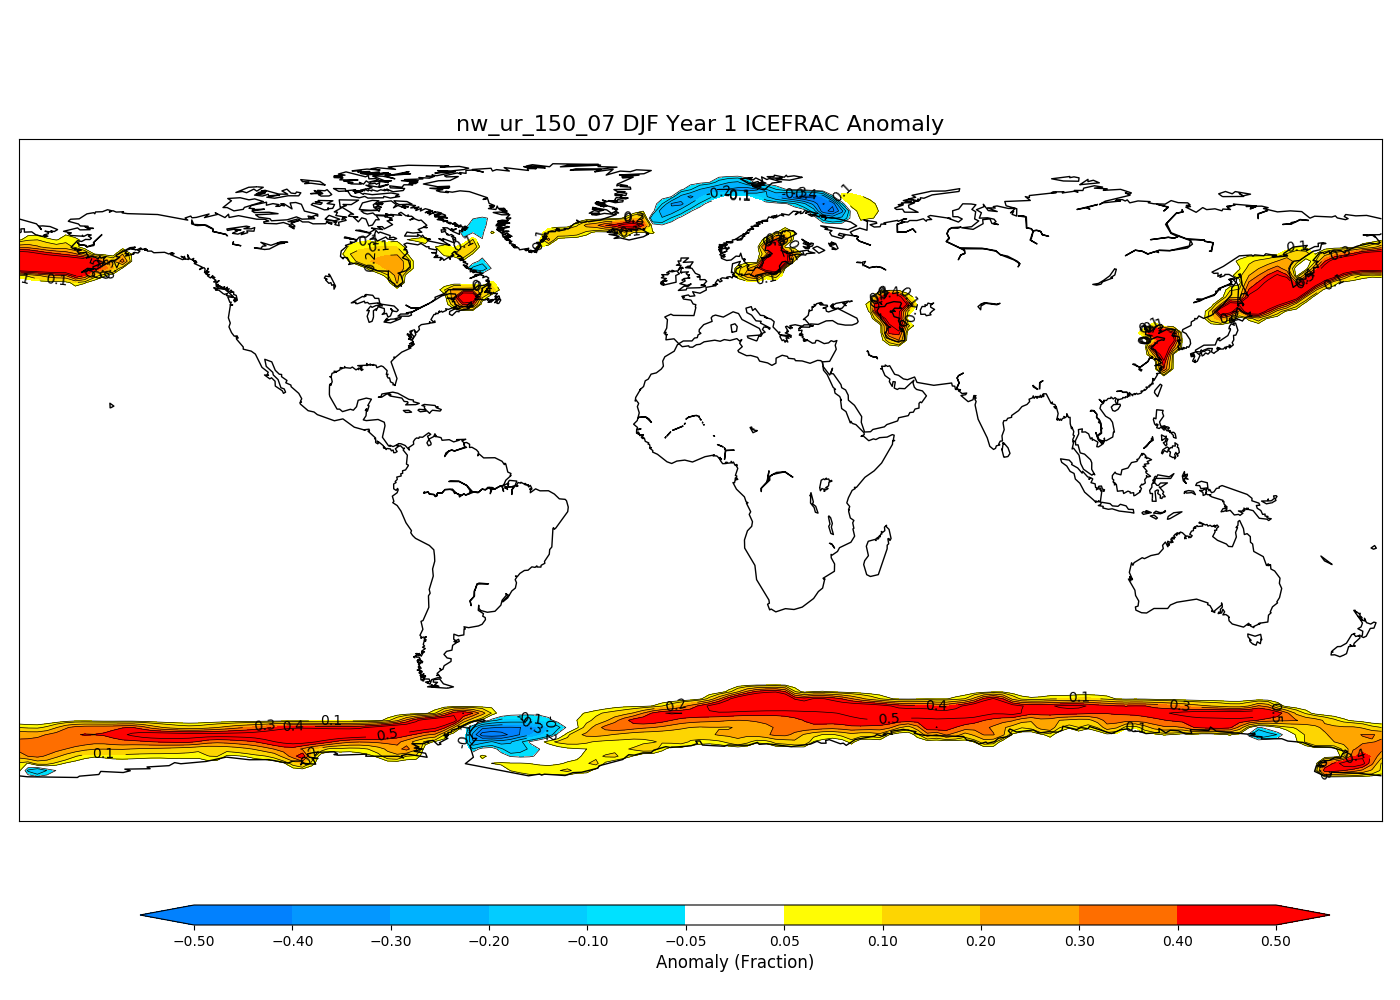
El Nino conditions after 150 Tg black carbon injection
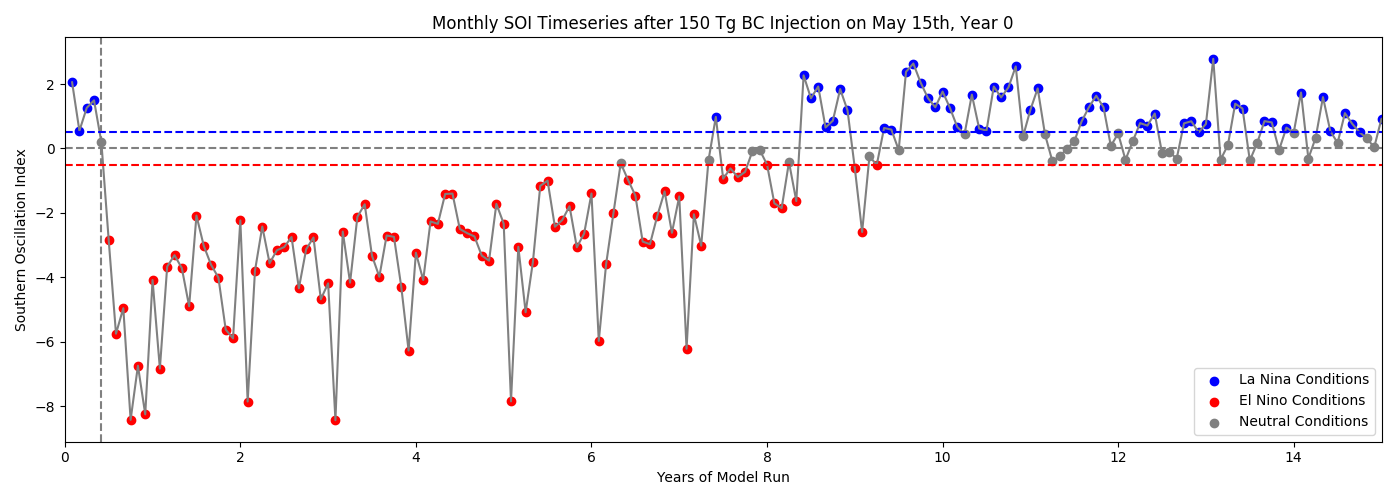
SOI-based index: (pressure difference between Tahiti and Darwin)
YES
El Nino conditions after 150 Tg black carbon injection
SOI-based index: (pressure difference between Tahiti and Darwin)
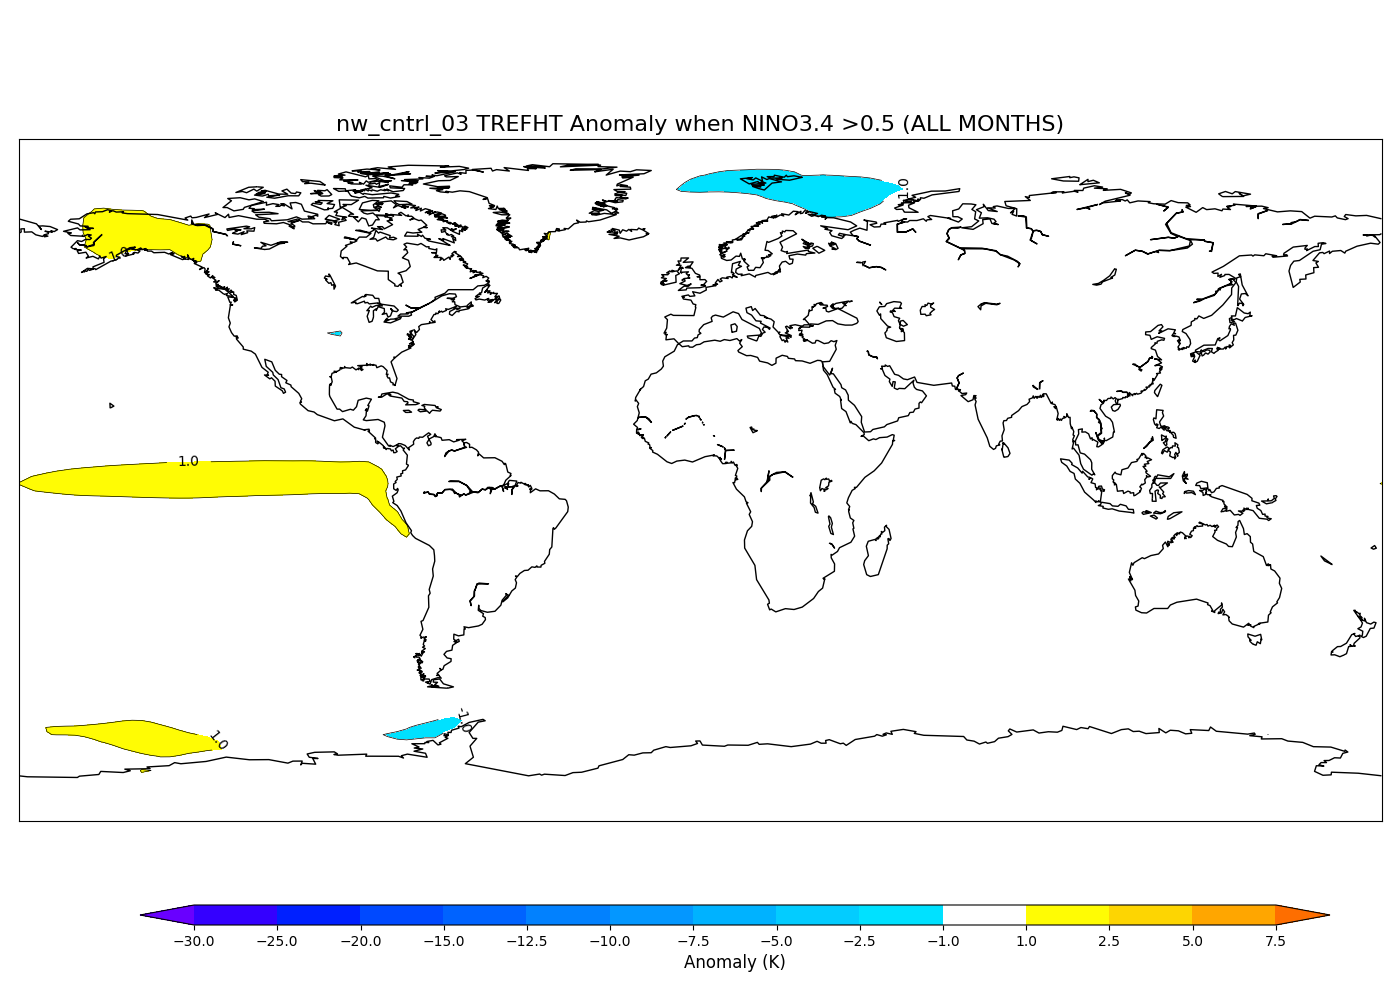
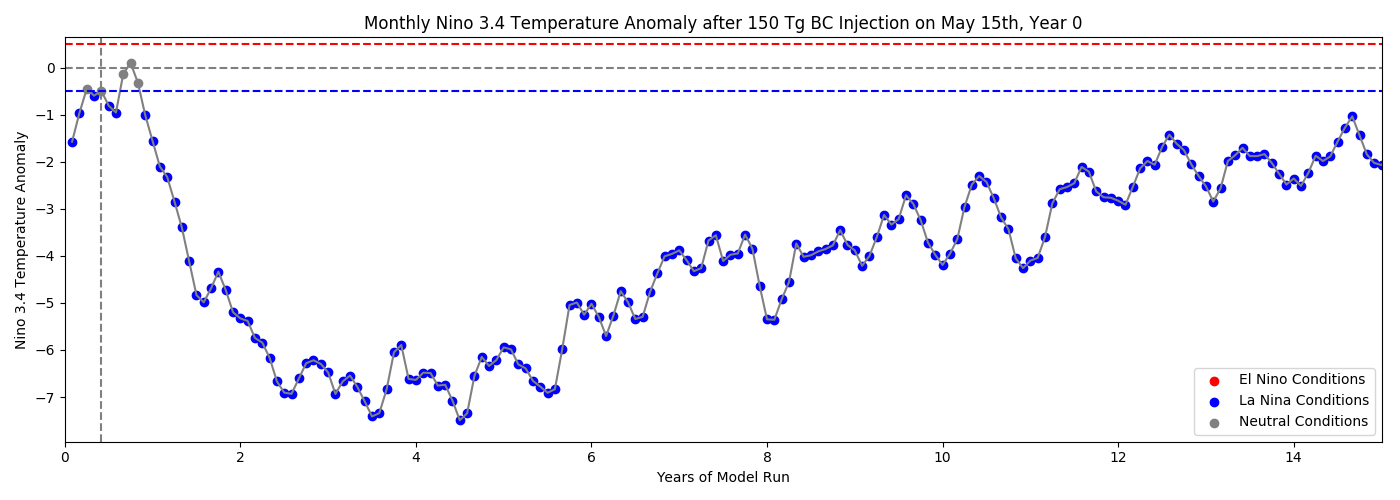
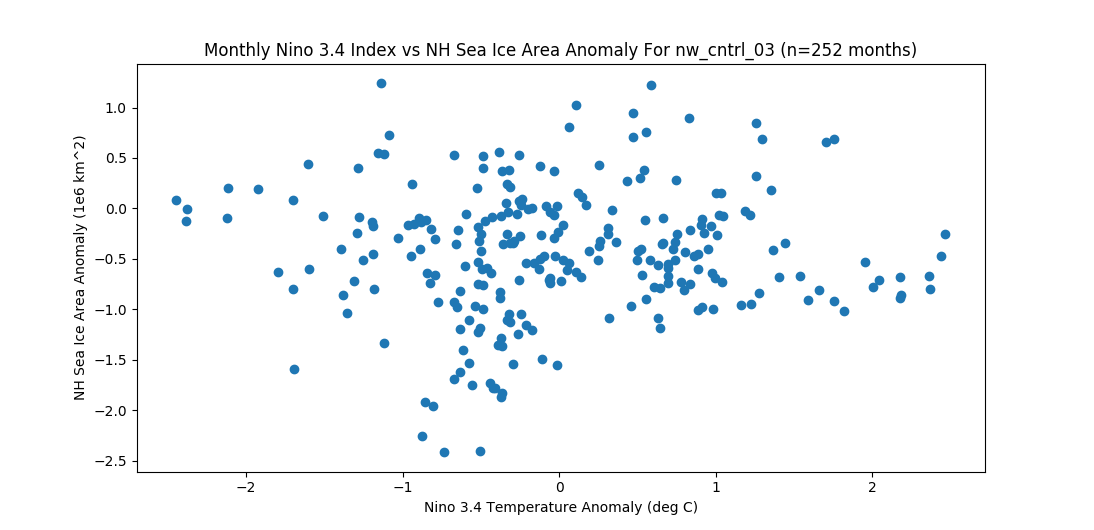
Nino 3.4 based index: (5S To 5N; 170W - 120W). Obviously not the best measure because of ongoing global cooling.
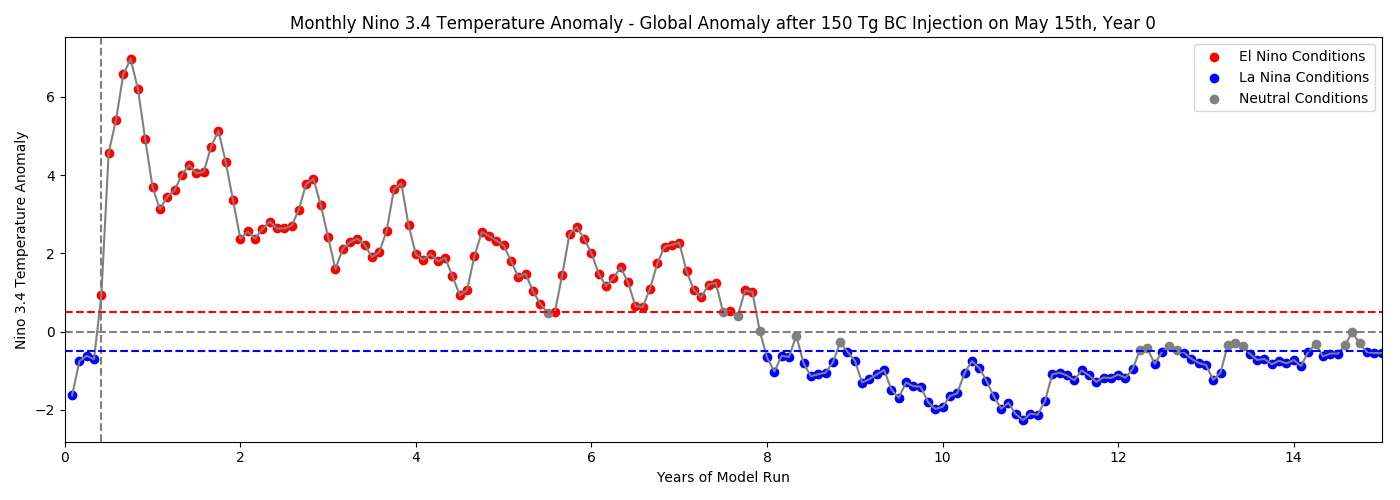
Normalized by global mean surface temperature, which is an attempt to filter out global cooling signal:
Quantifying El Nino during the control run:
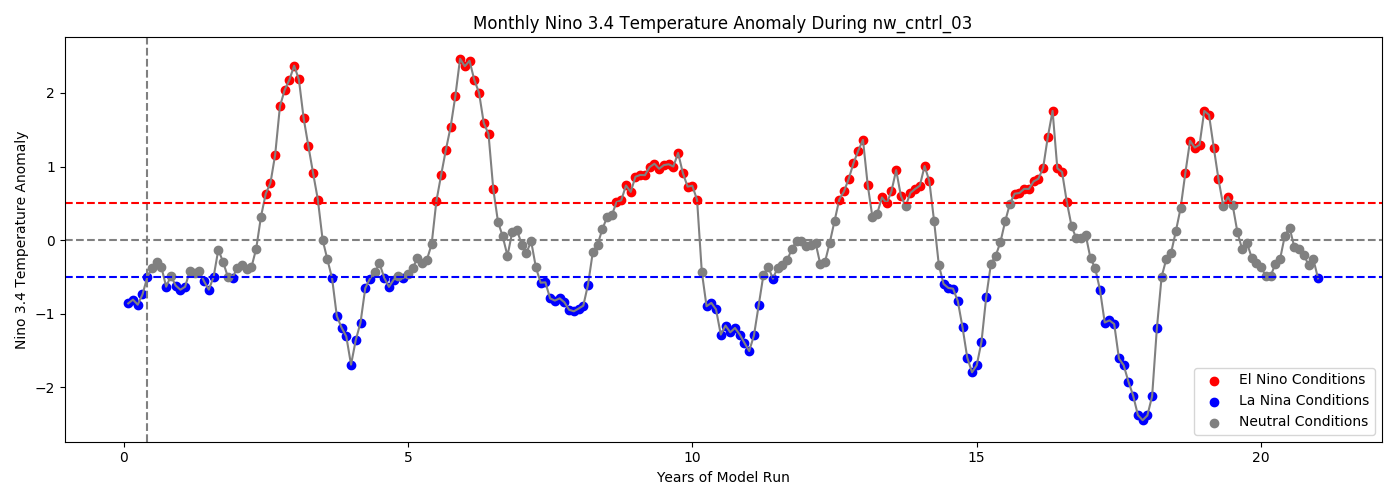
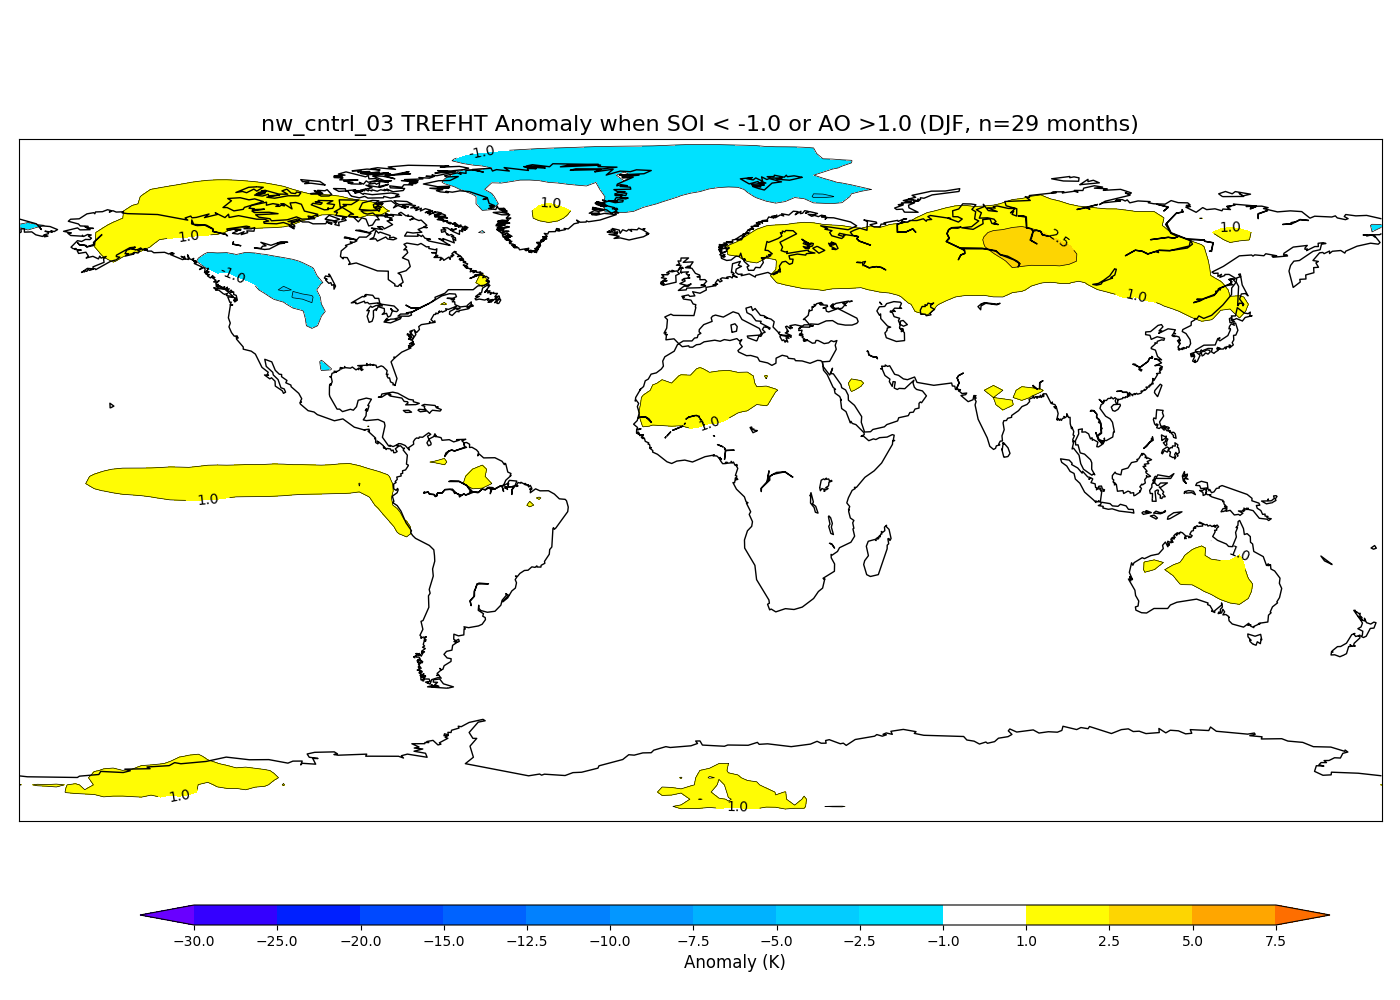
Impact of El Nino and AO on Winter Warming
Interested in determining the temperature impact of El Nino conditions in the first winter after a 150 Tg soot injection. I isolated all winter months with a SOI < -1.0, an AO > 1.0, and all winter months with both of these conditions.
All winter months with an SOI < - 1.0 (El Nino conditions):
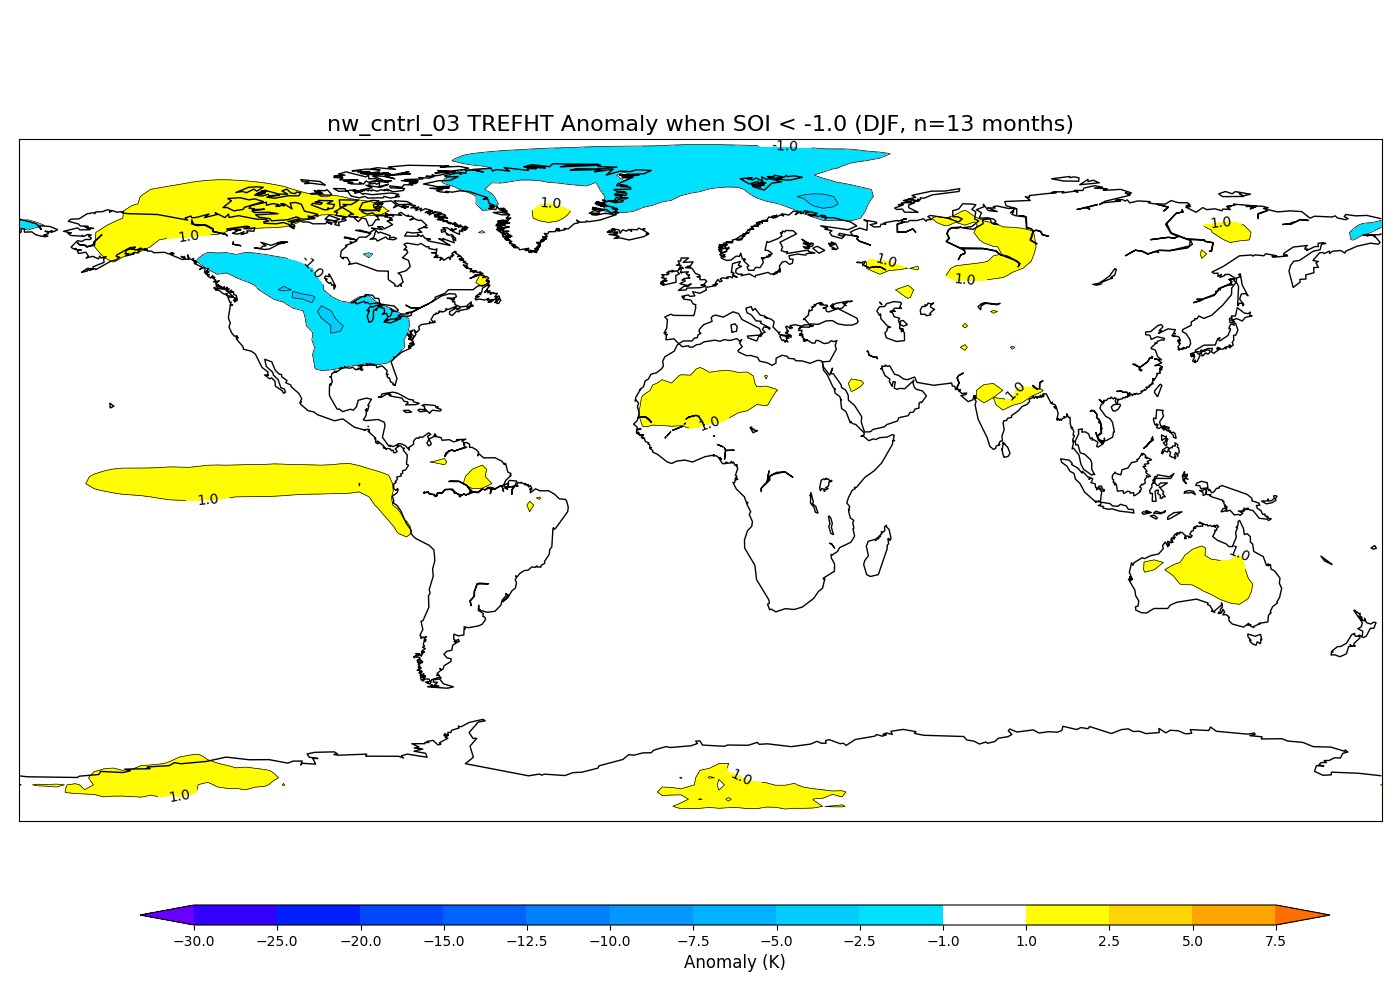
Cooling on the order of 1C is observed across parts of the Arctic during a composite of 13 winter months with strong El Nino conditions.
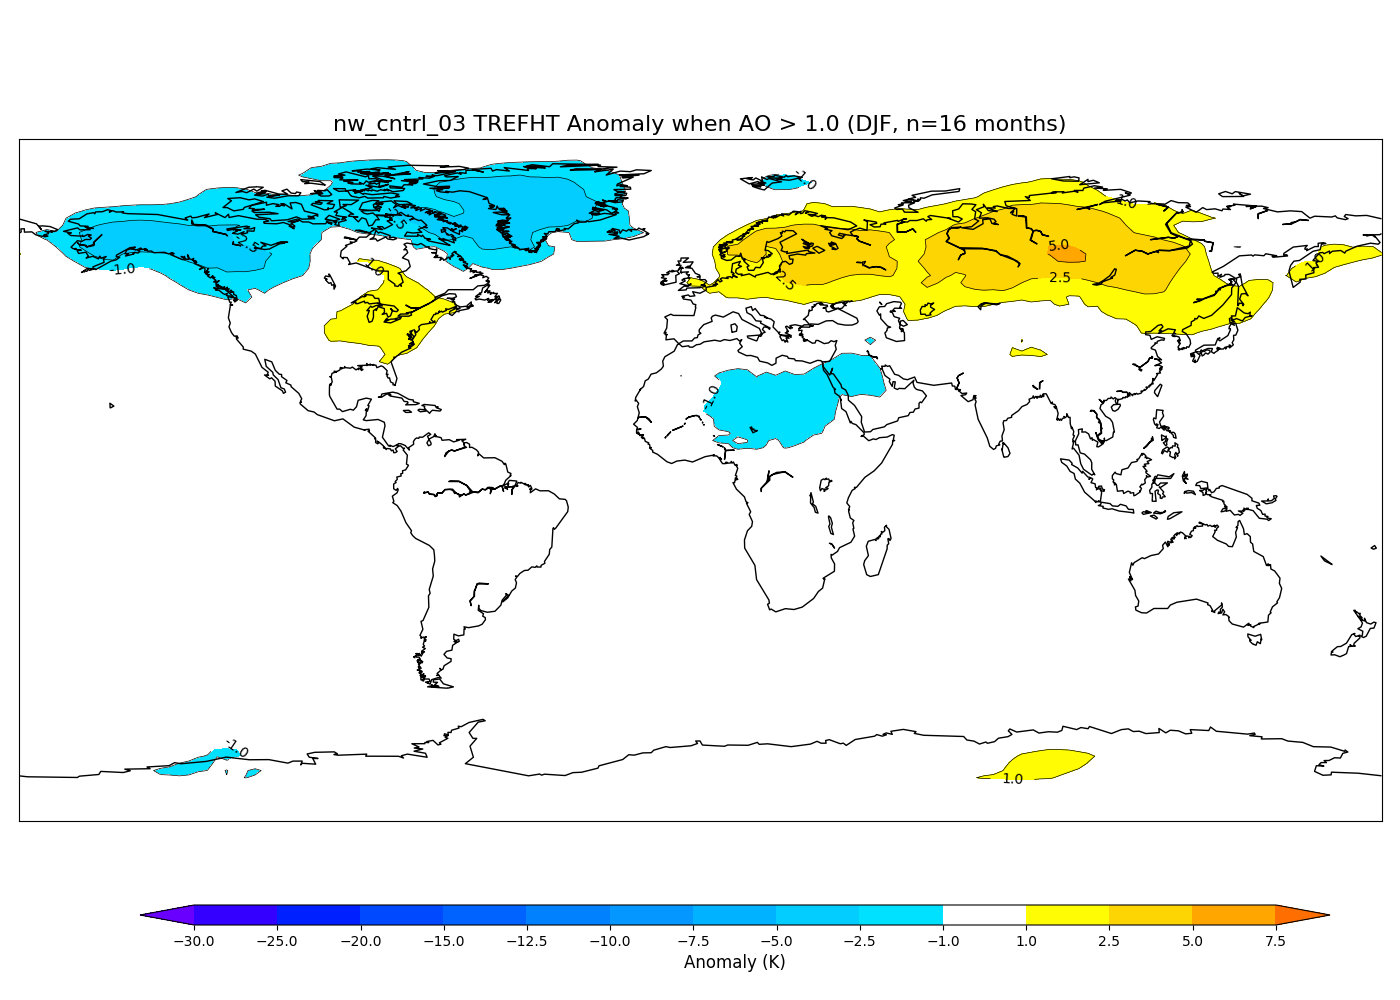
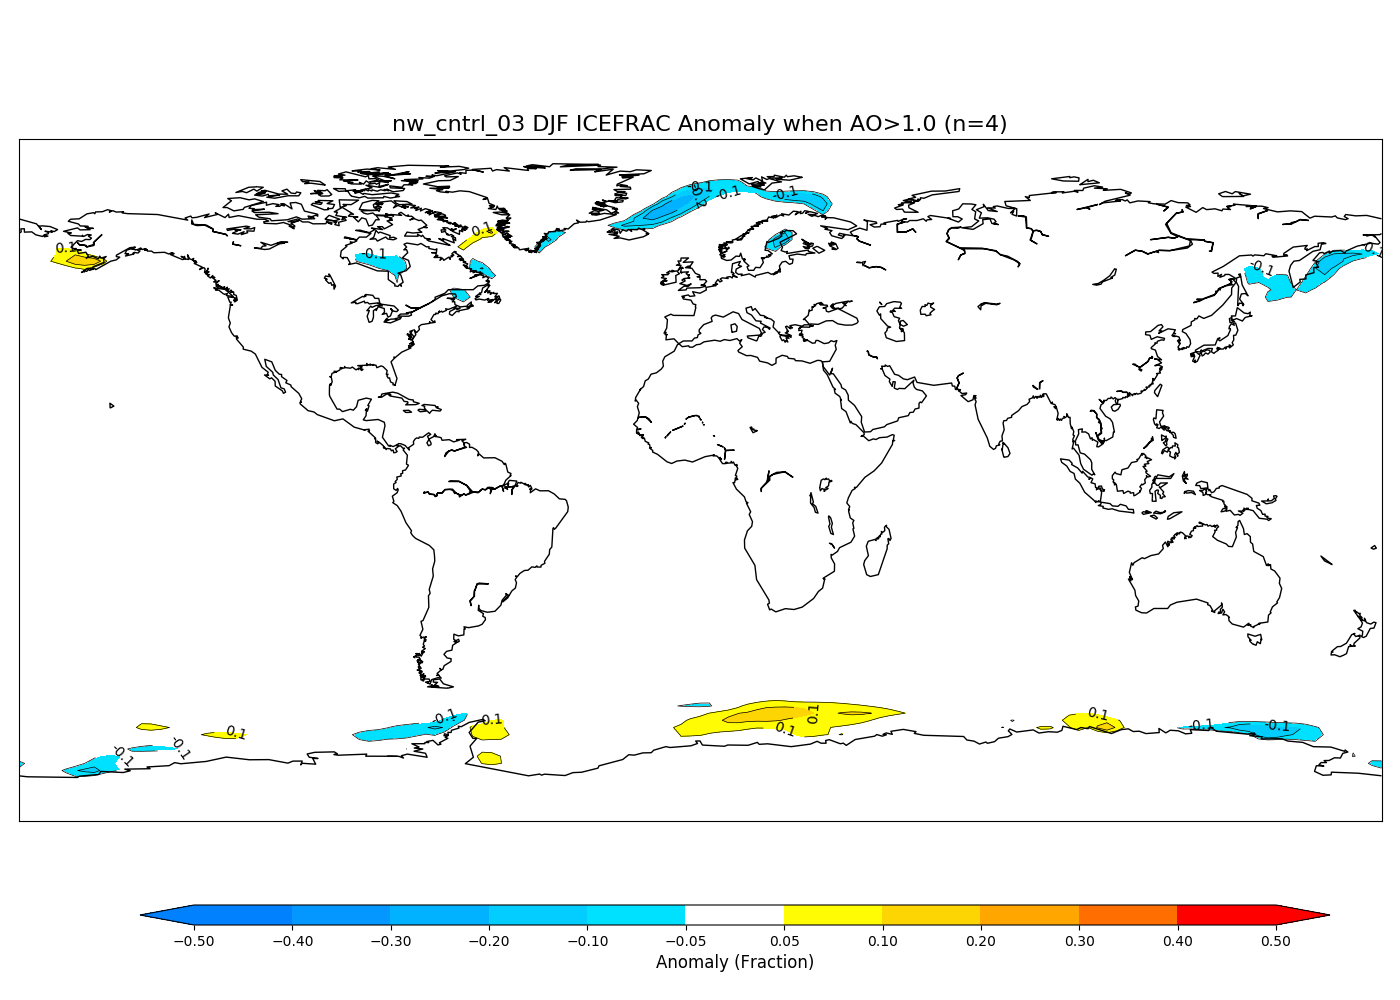
All winter months with an AO > 1.0:
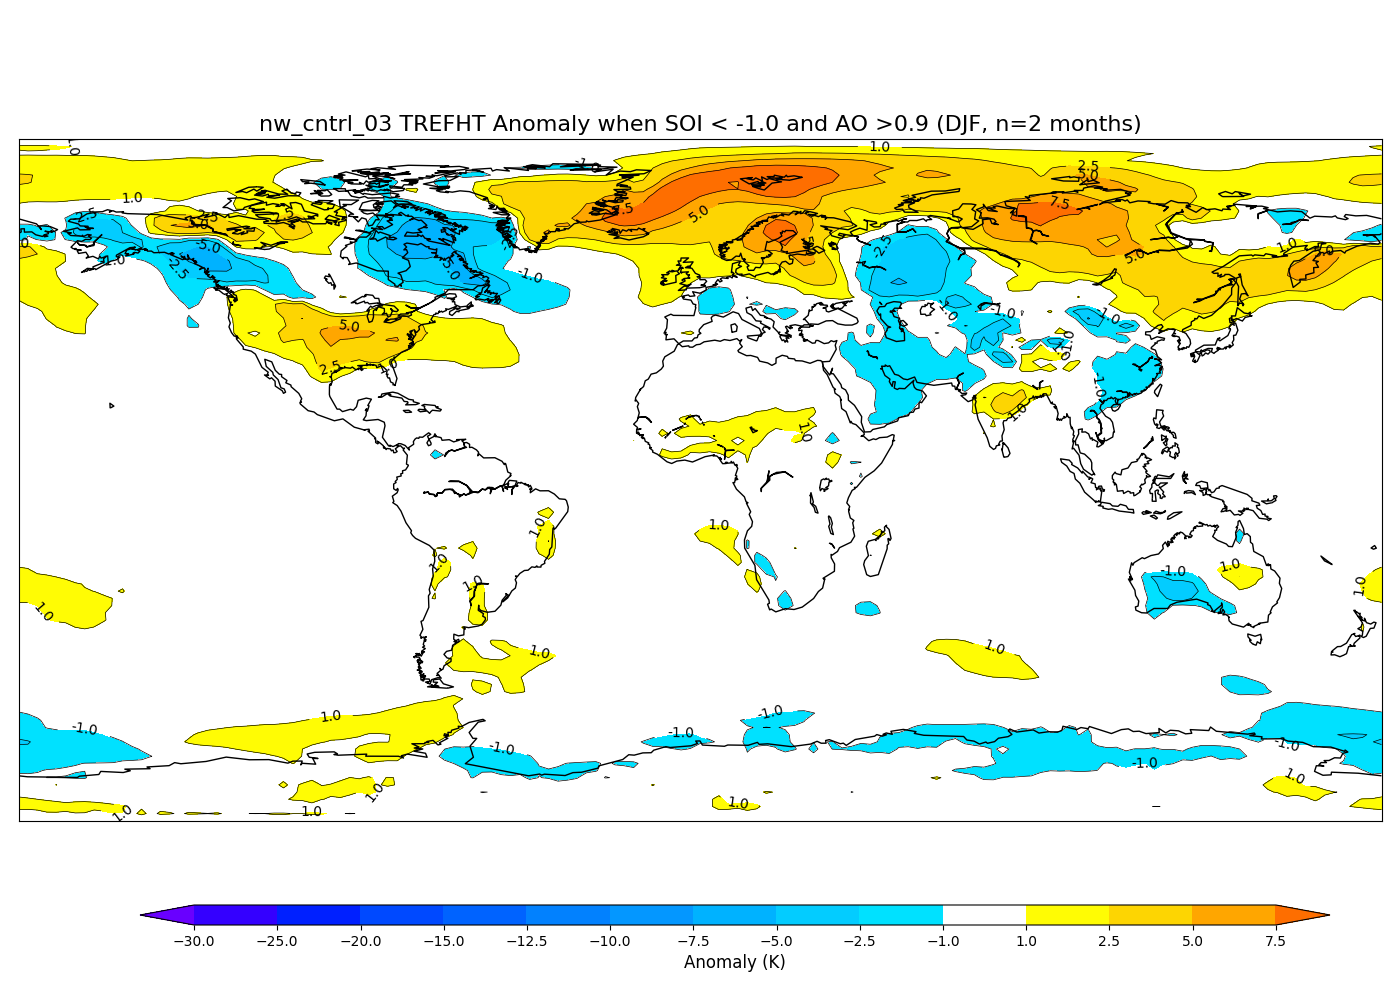
All winter months with an AO > 1.0 AND SOI < -1.0:
There are only two winter months during the nw_cntrl_03 control run that exhibit the same SOI and AO conditions as following a 150 Tg soot injection.
Month 084: AO of 0.916 and SOI of -6.221
Month 180: AO of 2.442 and SOI of -1.257
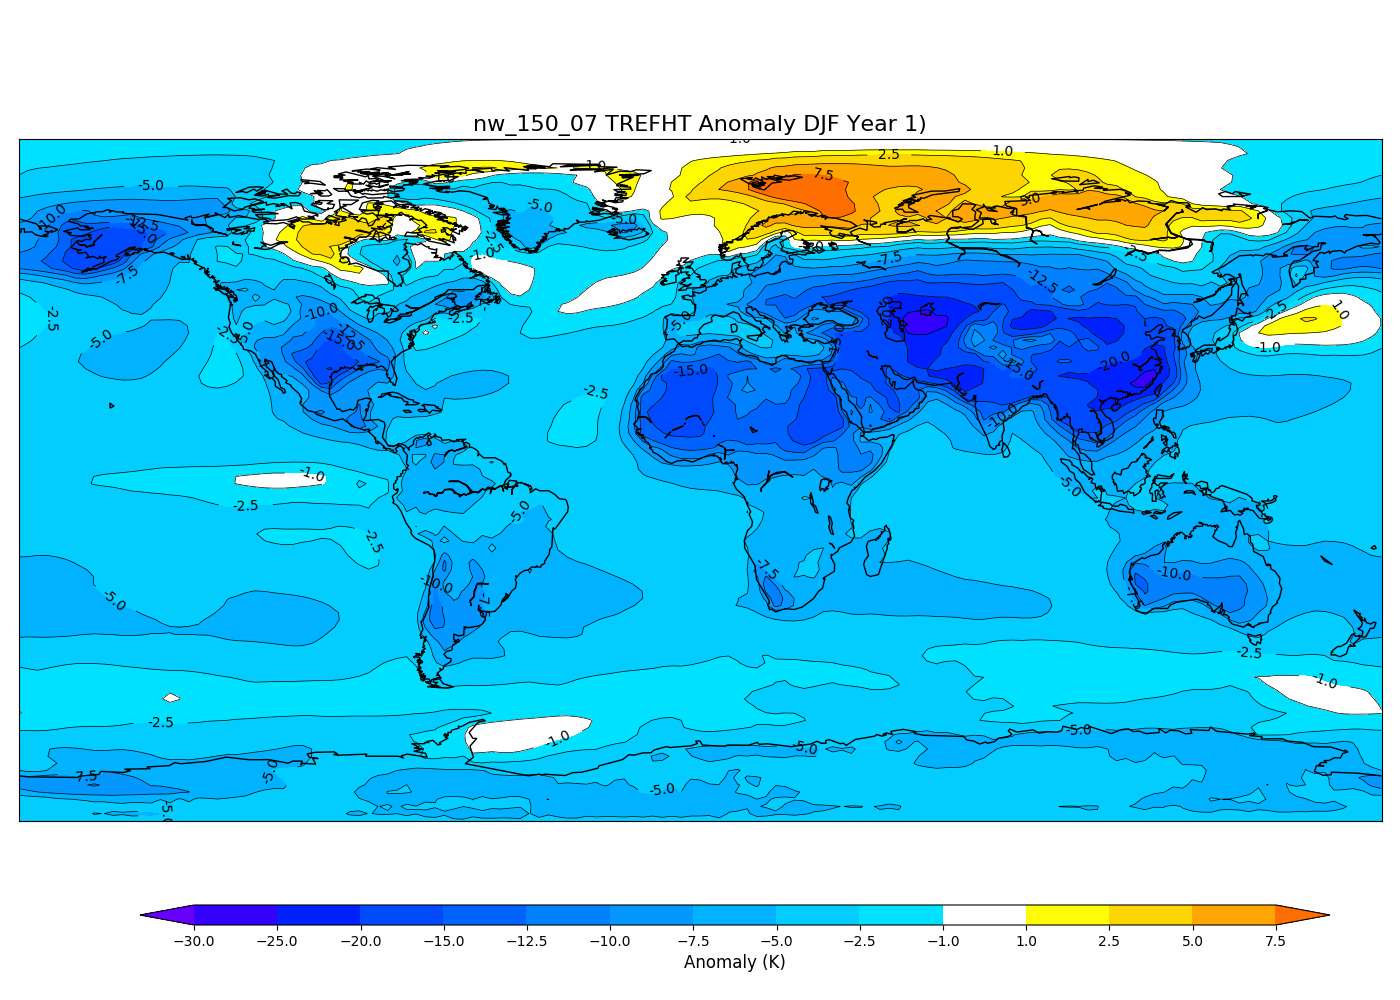
Remarkably, this looks very similar to the actual first DJF following a 150 Tg soot injection. The very strong +2.442 AO is what is mostly driving this temperature pattern, confirming my hypothesis that a very strong +AO would shift the typical warming experienced during a +AO northward. ENSO plays a mostly negligible role in driving polar temperatures during strong +AO winters.
=================================================================================
!! plot dump !!
=================================================================================
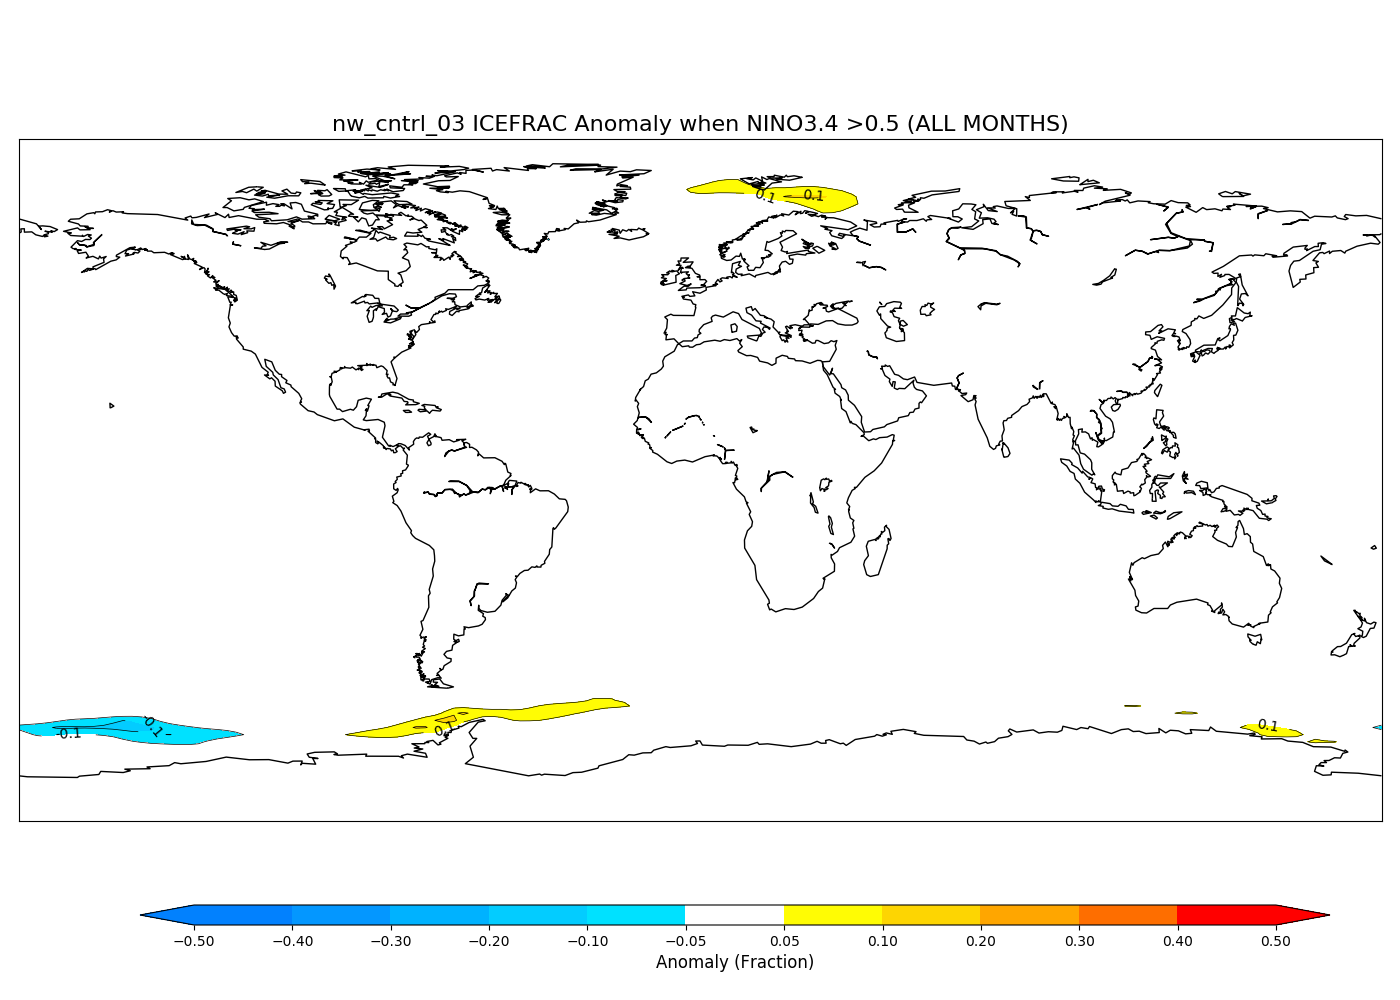
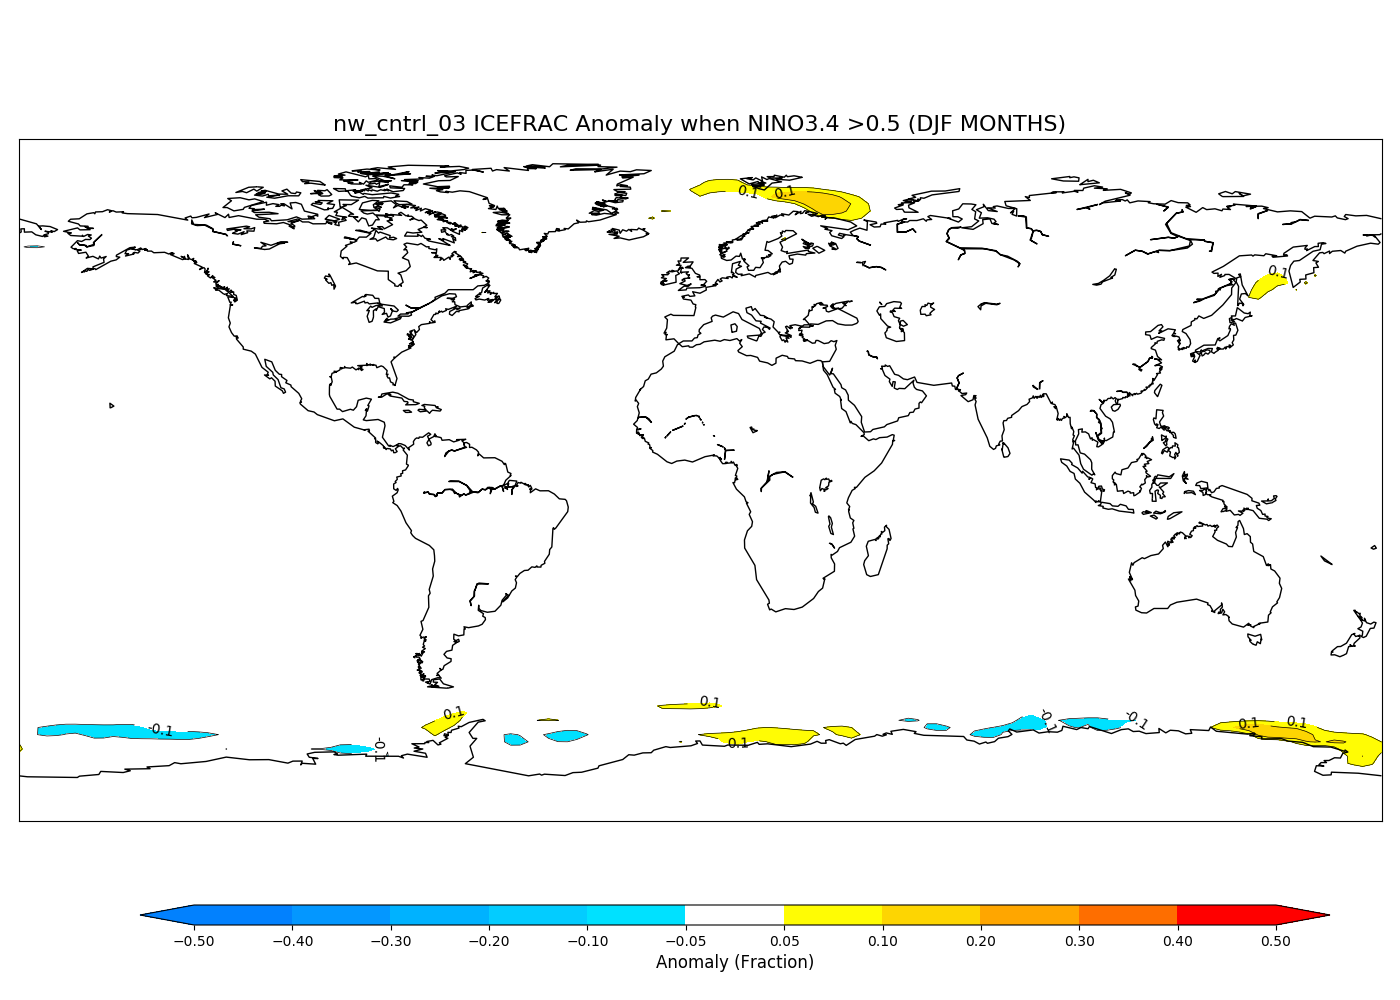
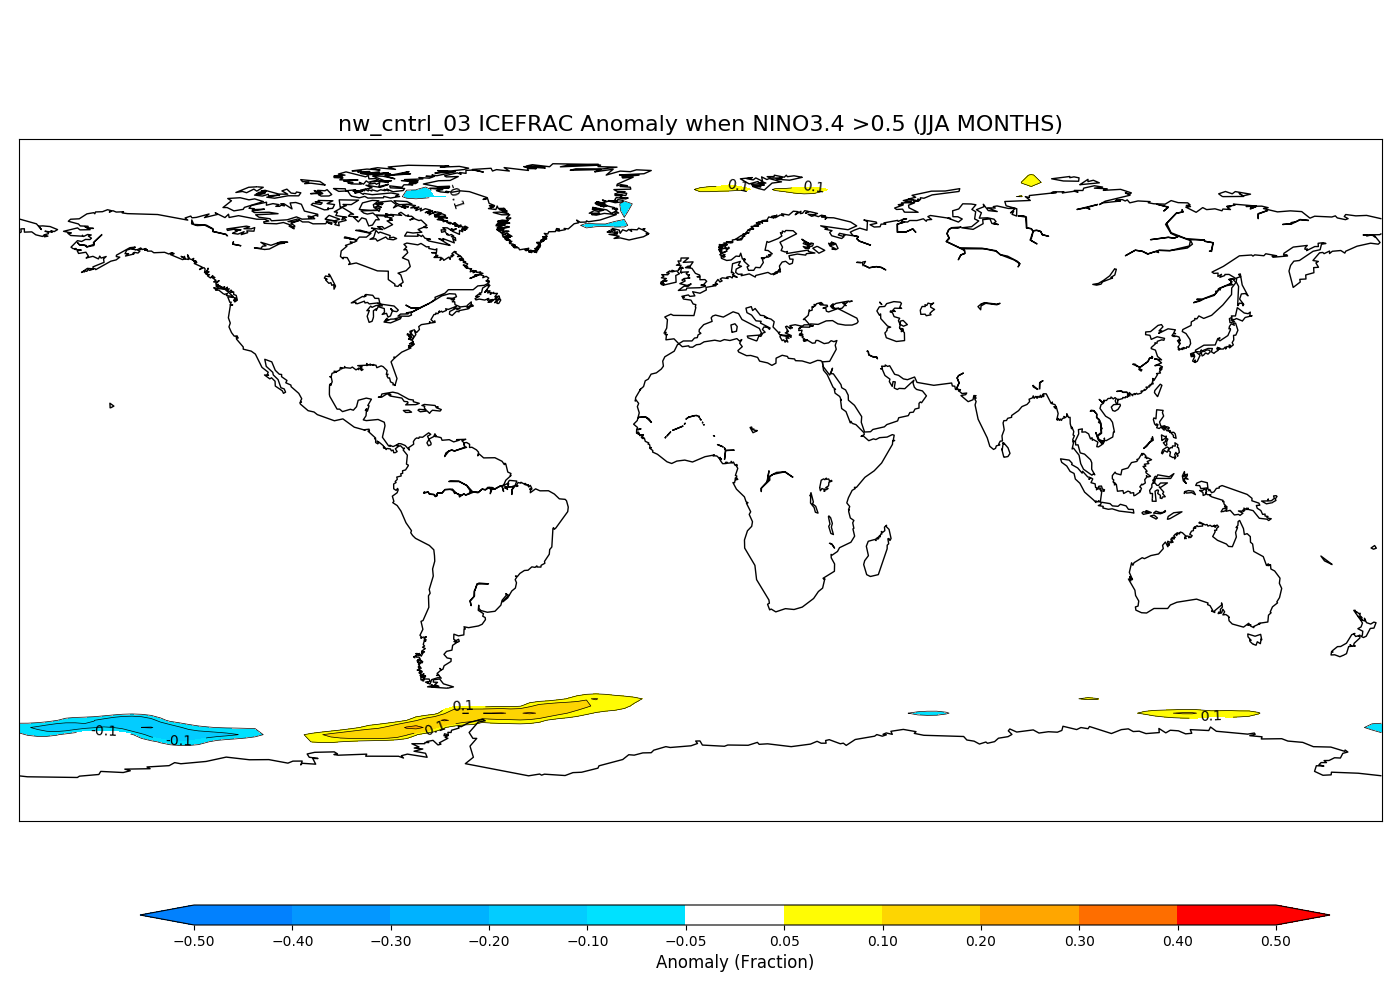
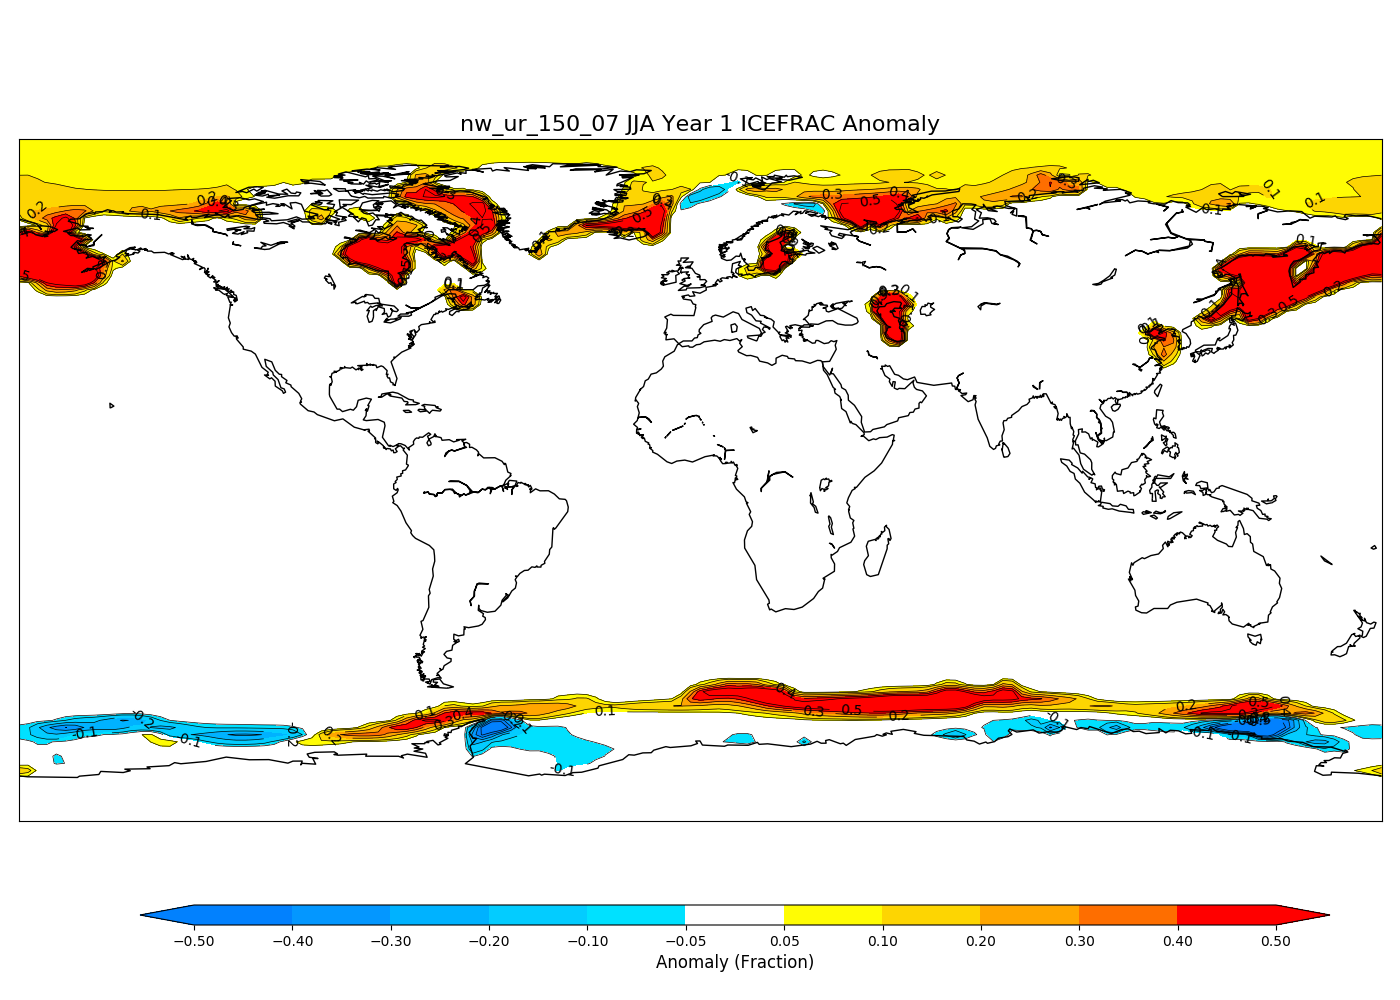
150 Tg nw_150_07 analysis of sea ice changes: el Nino
Temperature