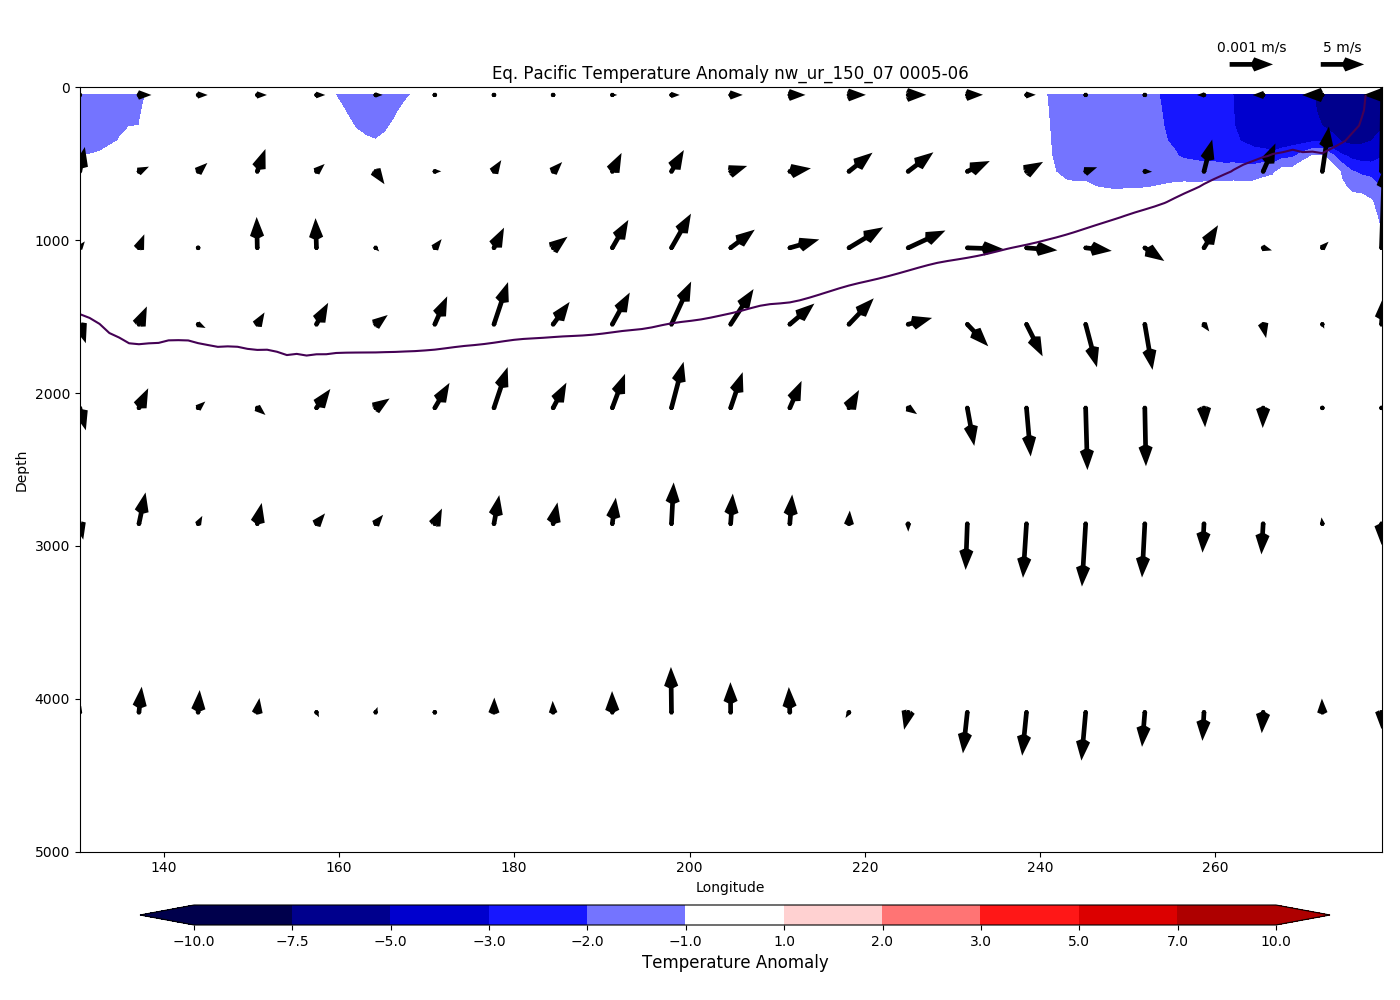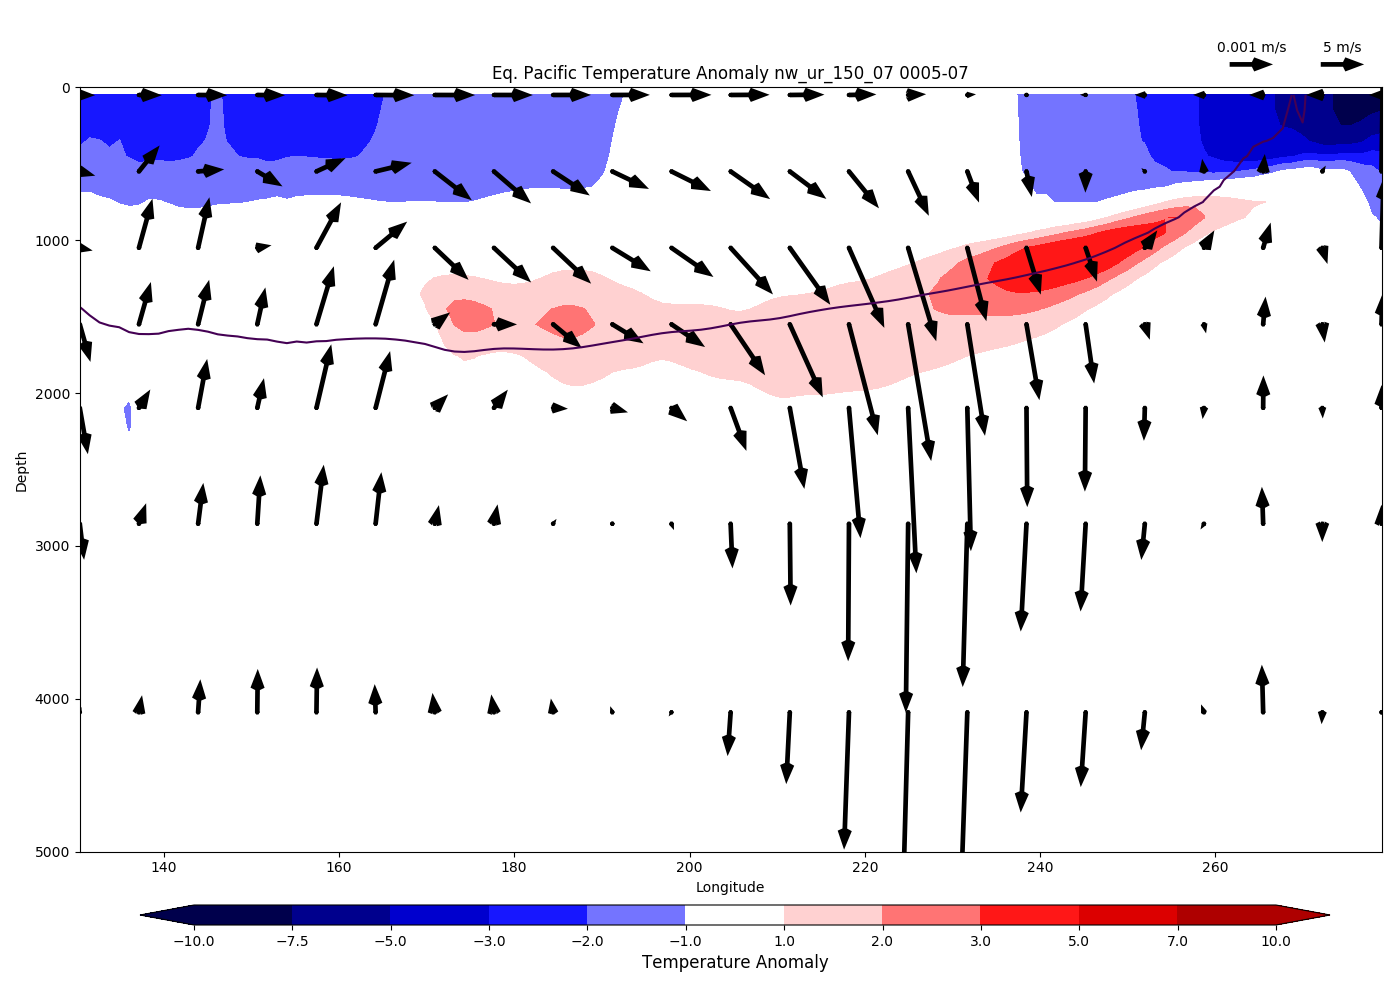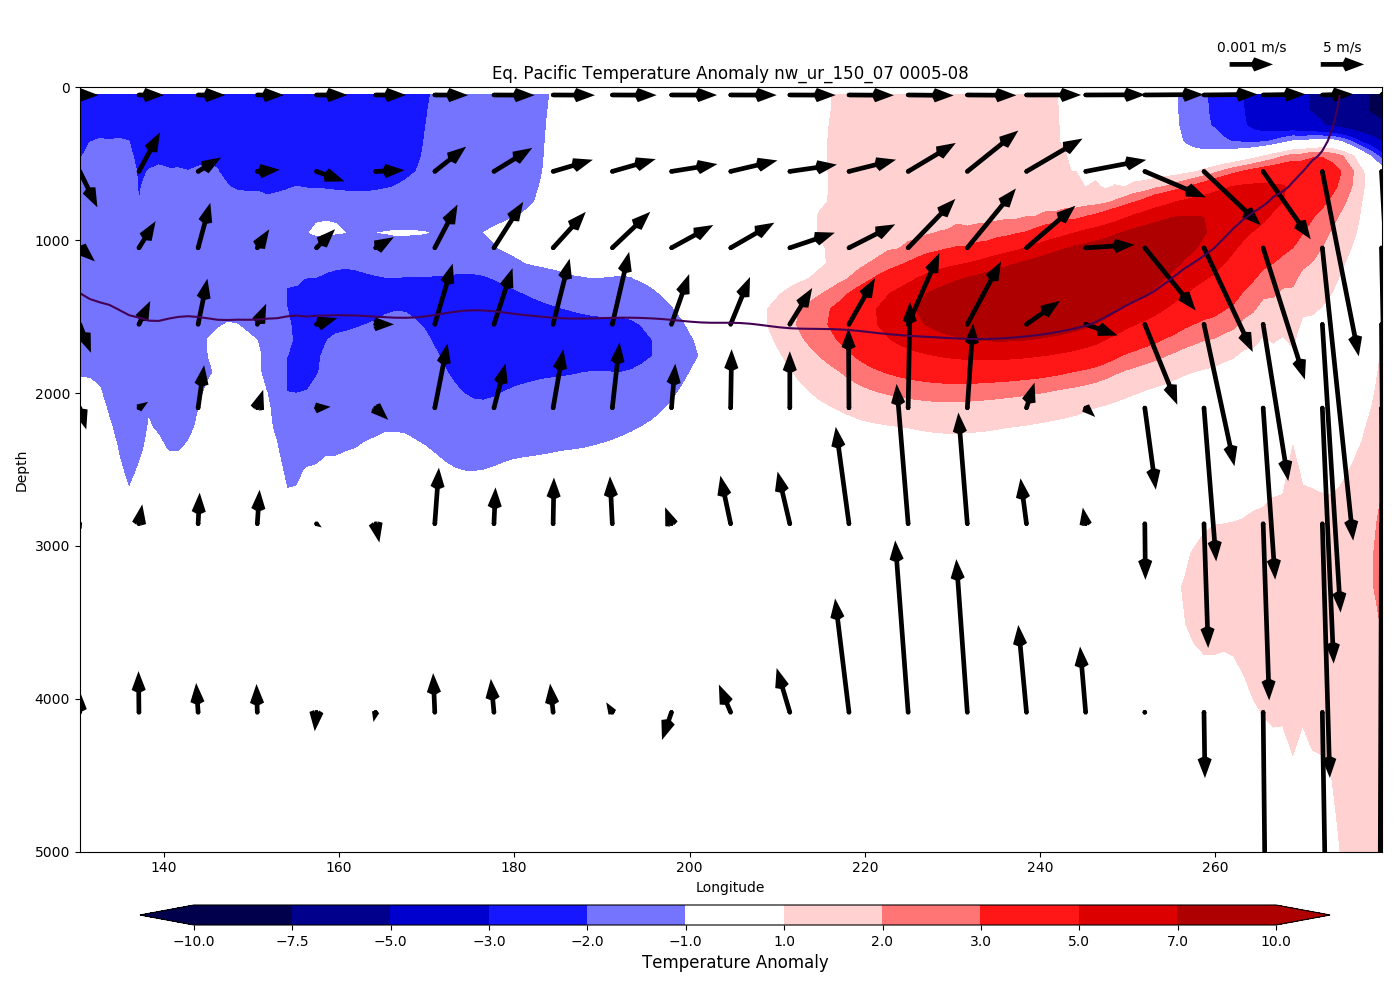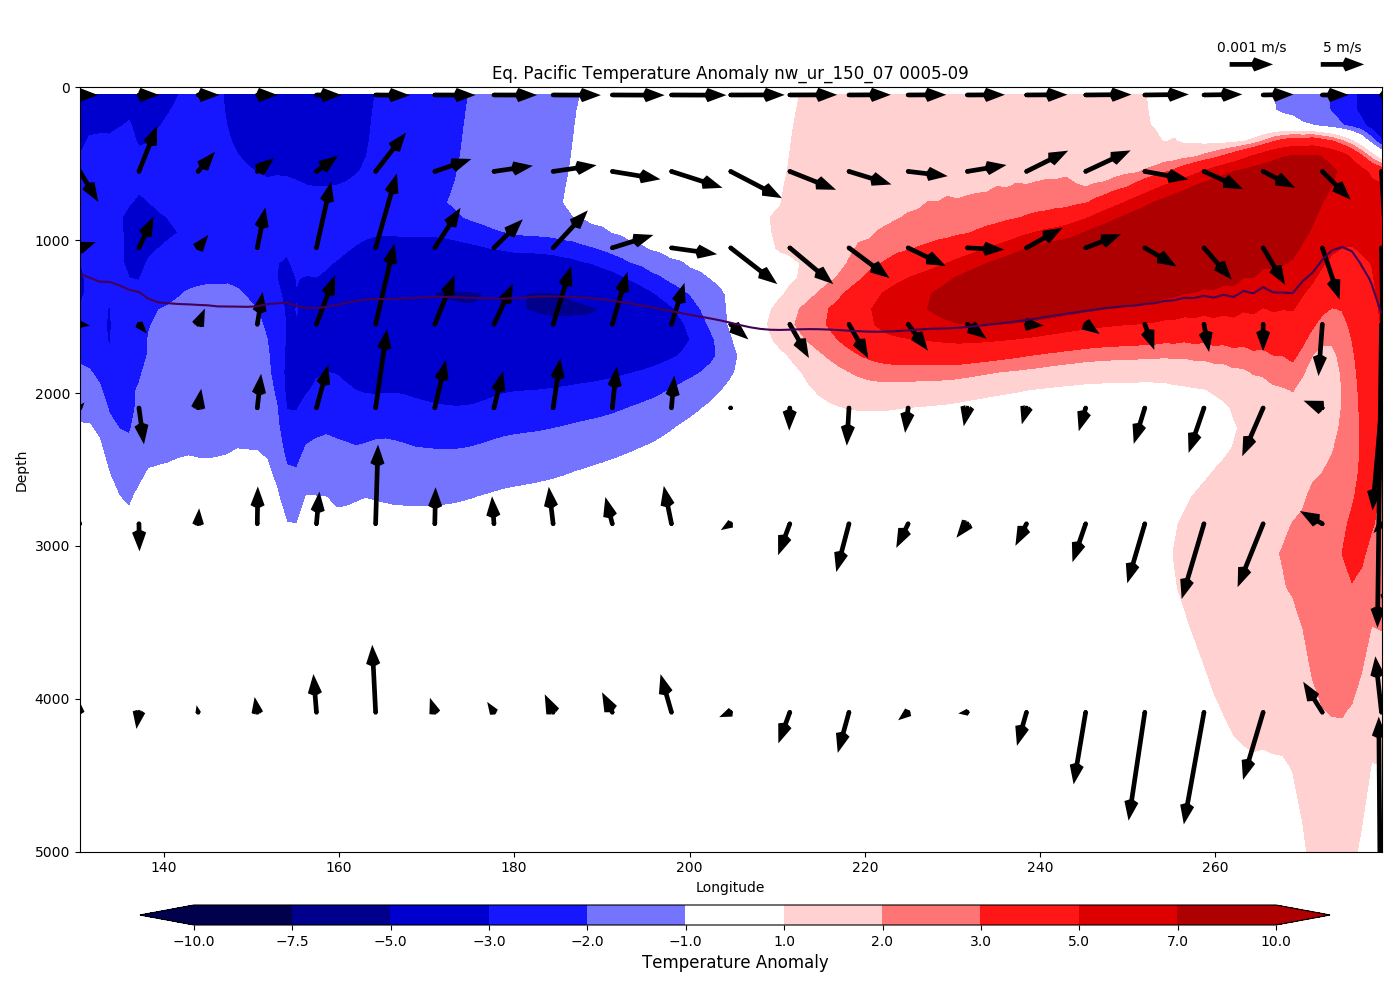
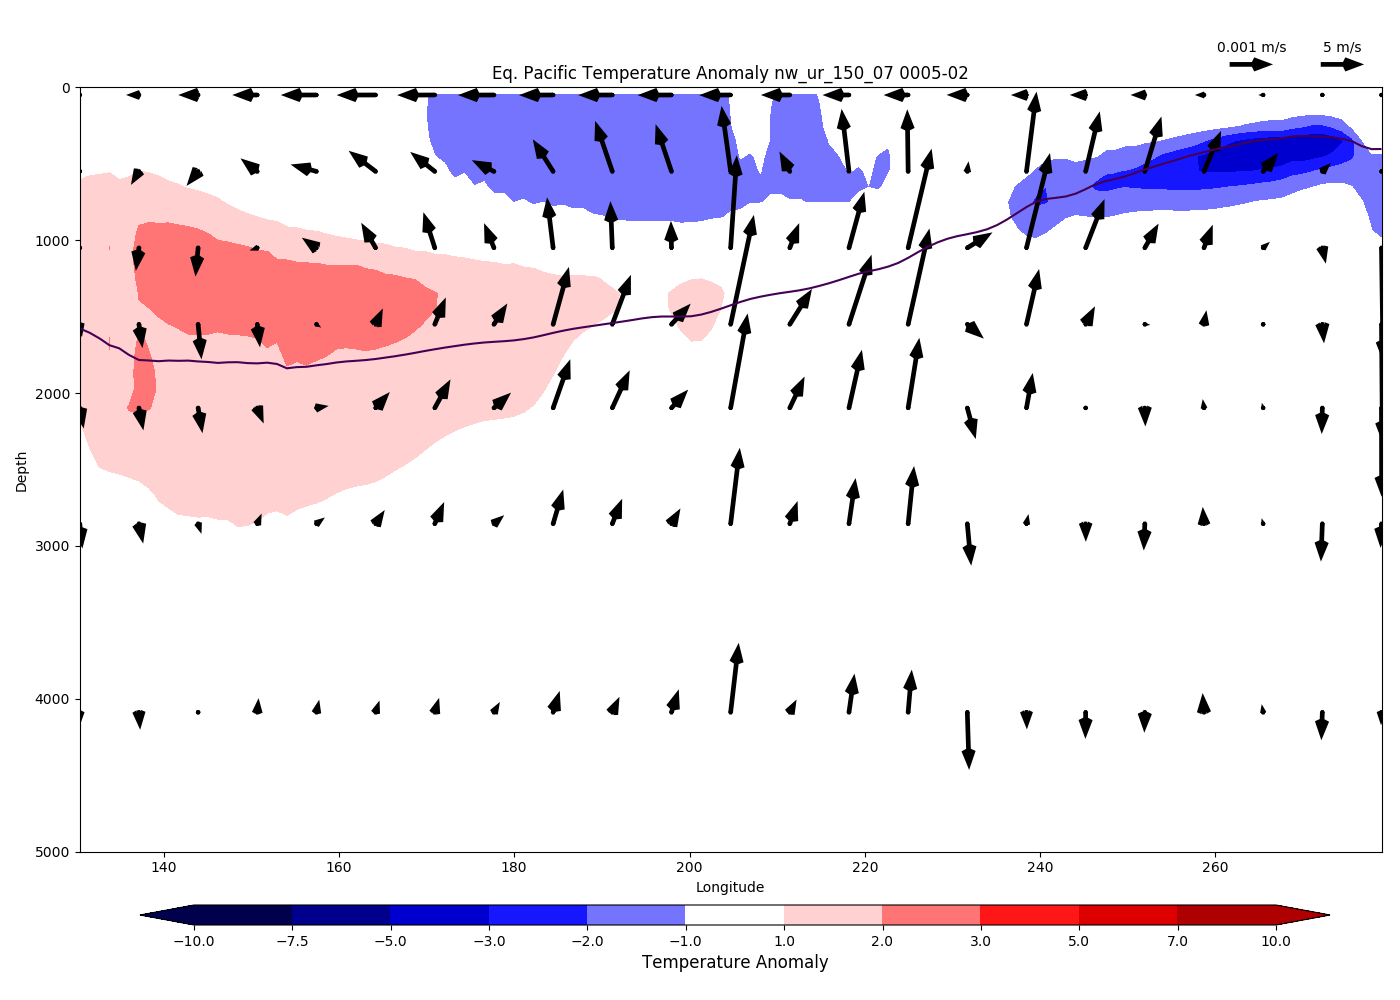
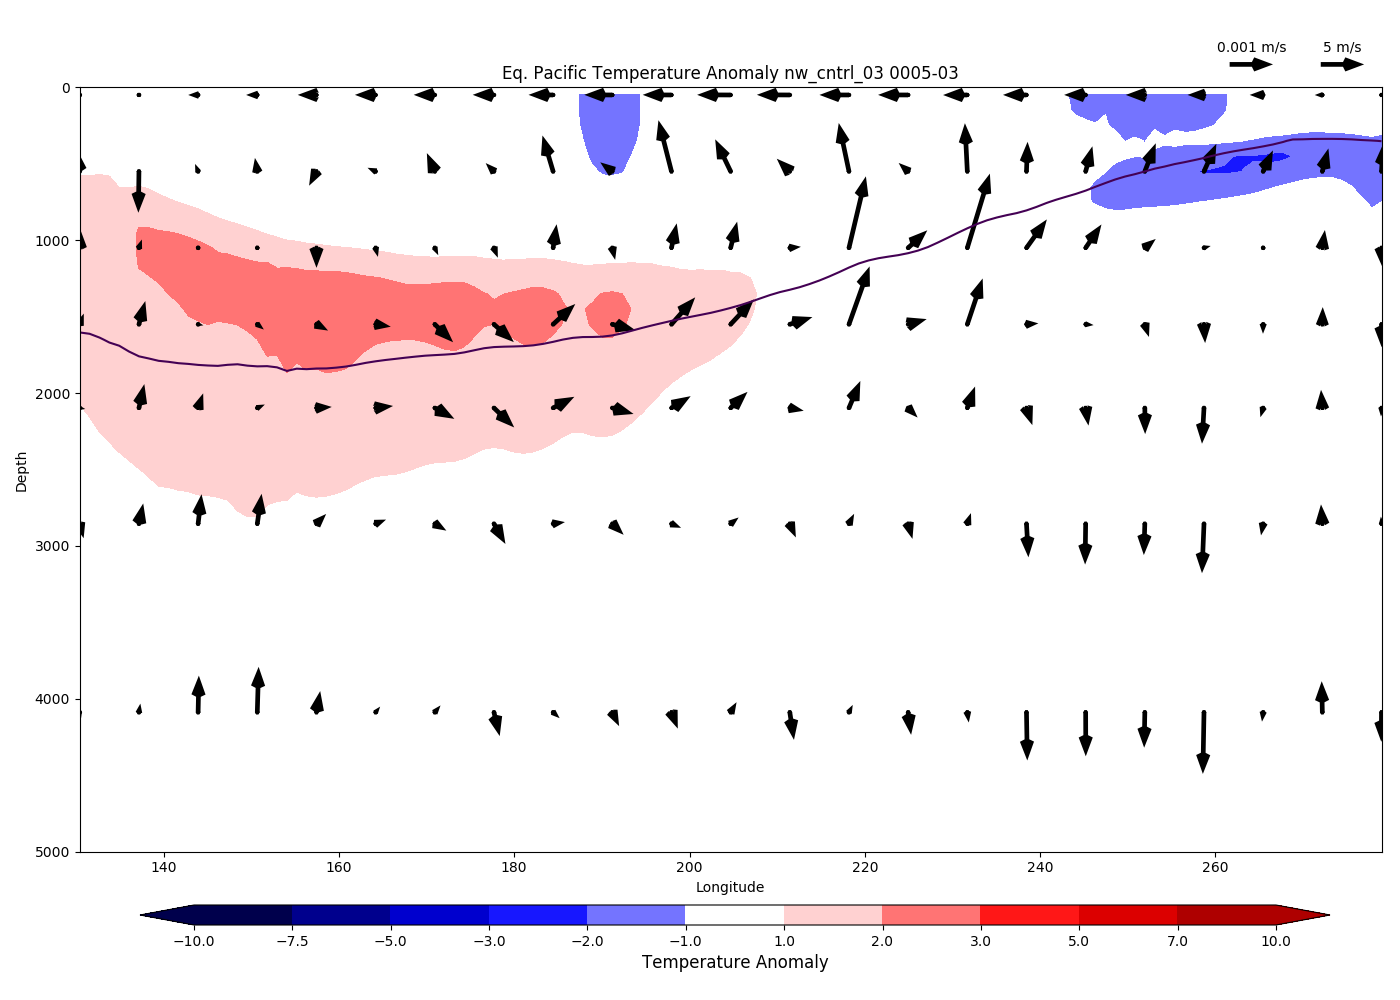
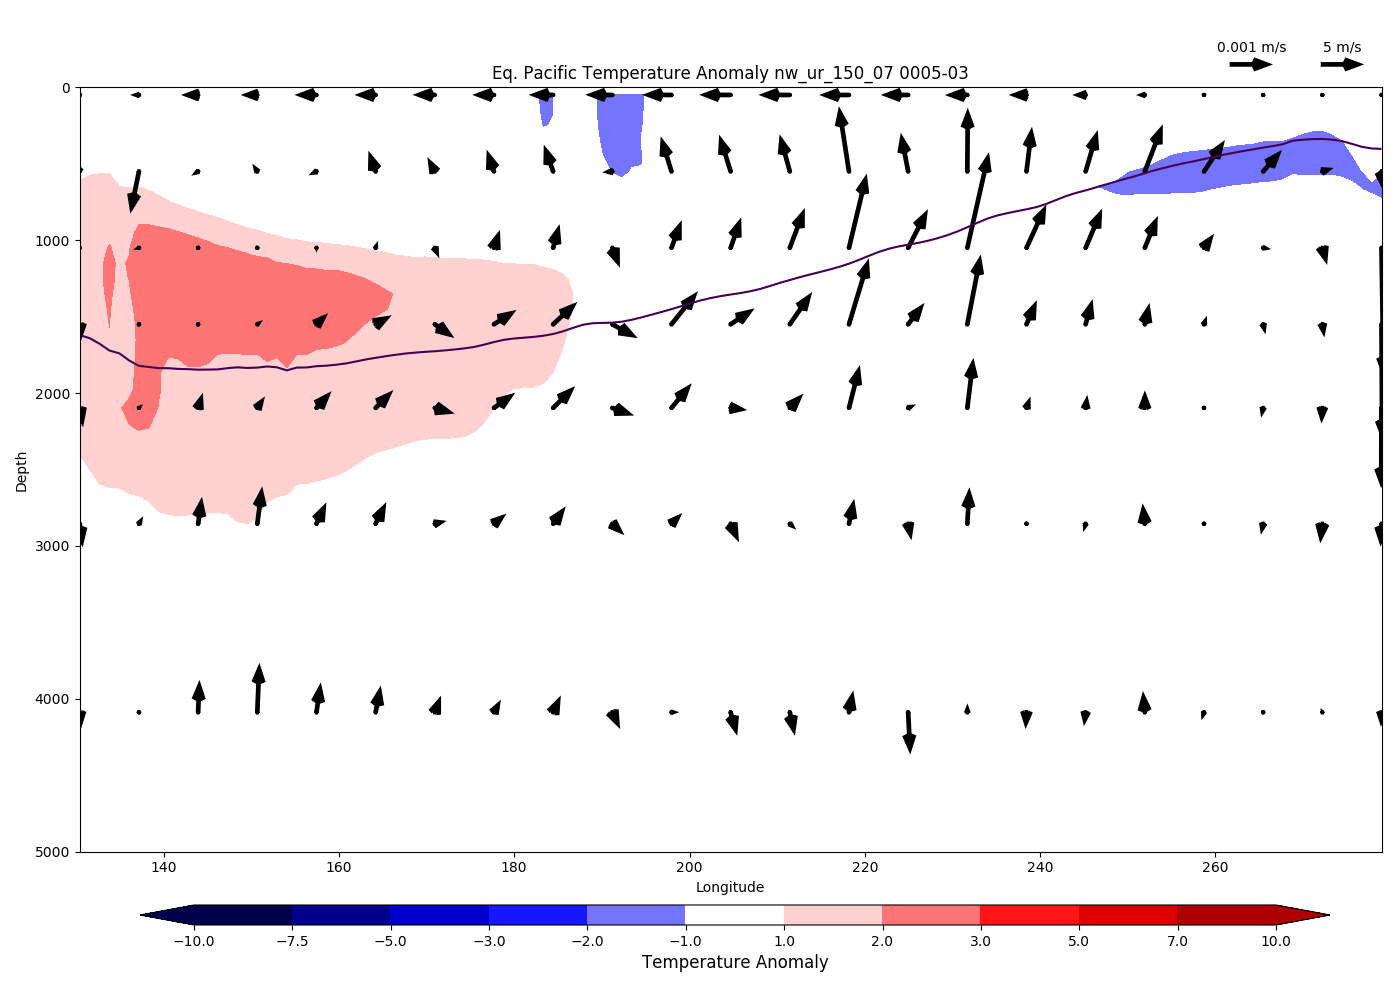
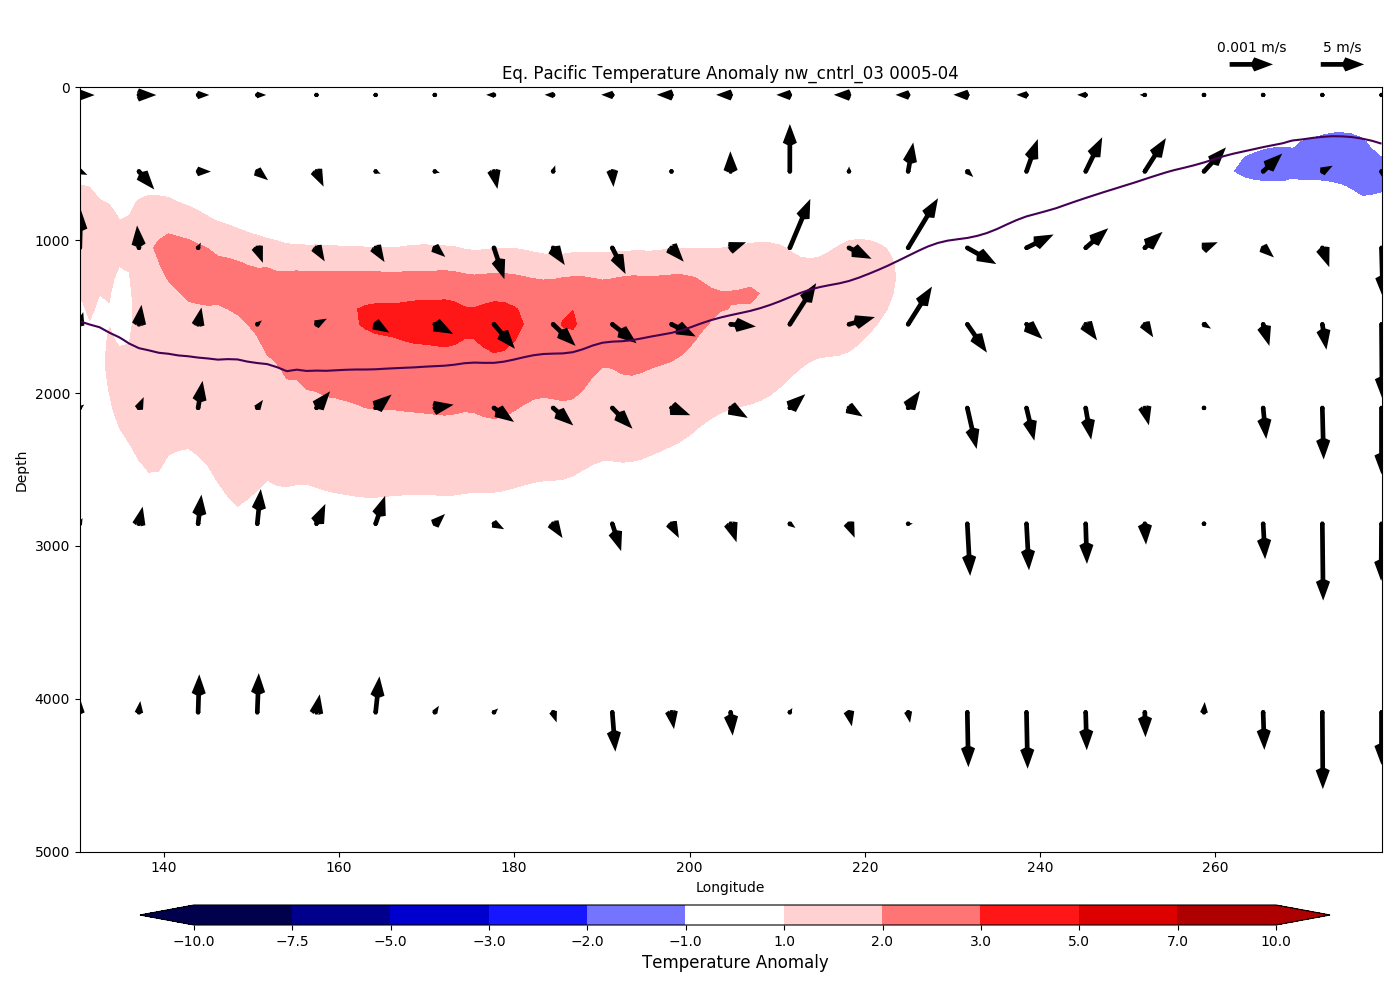
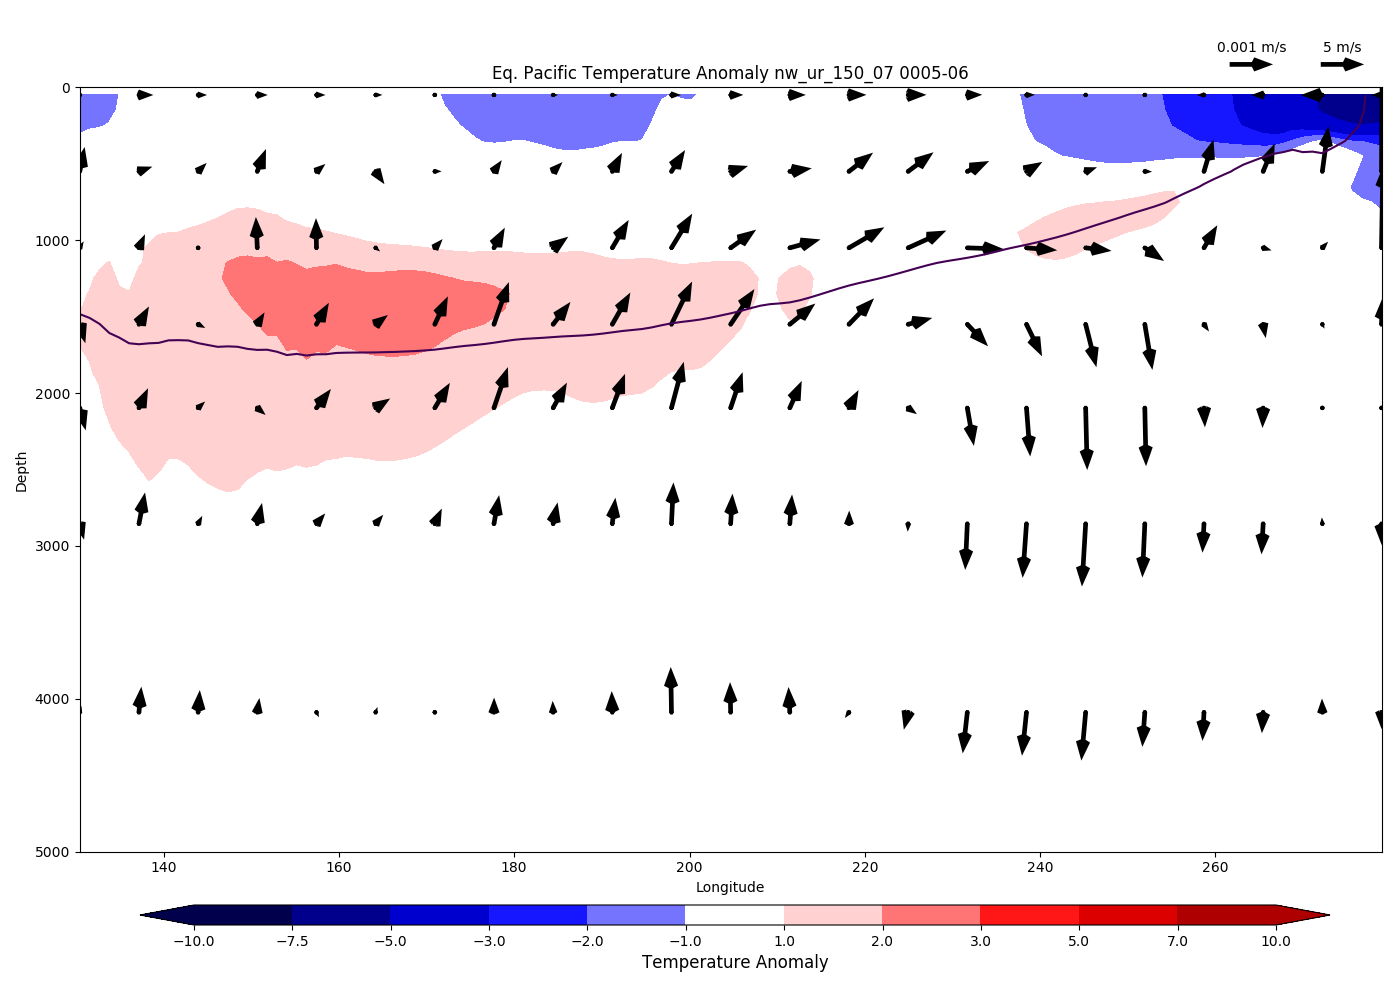
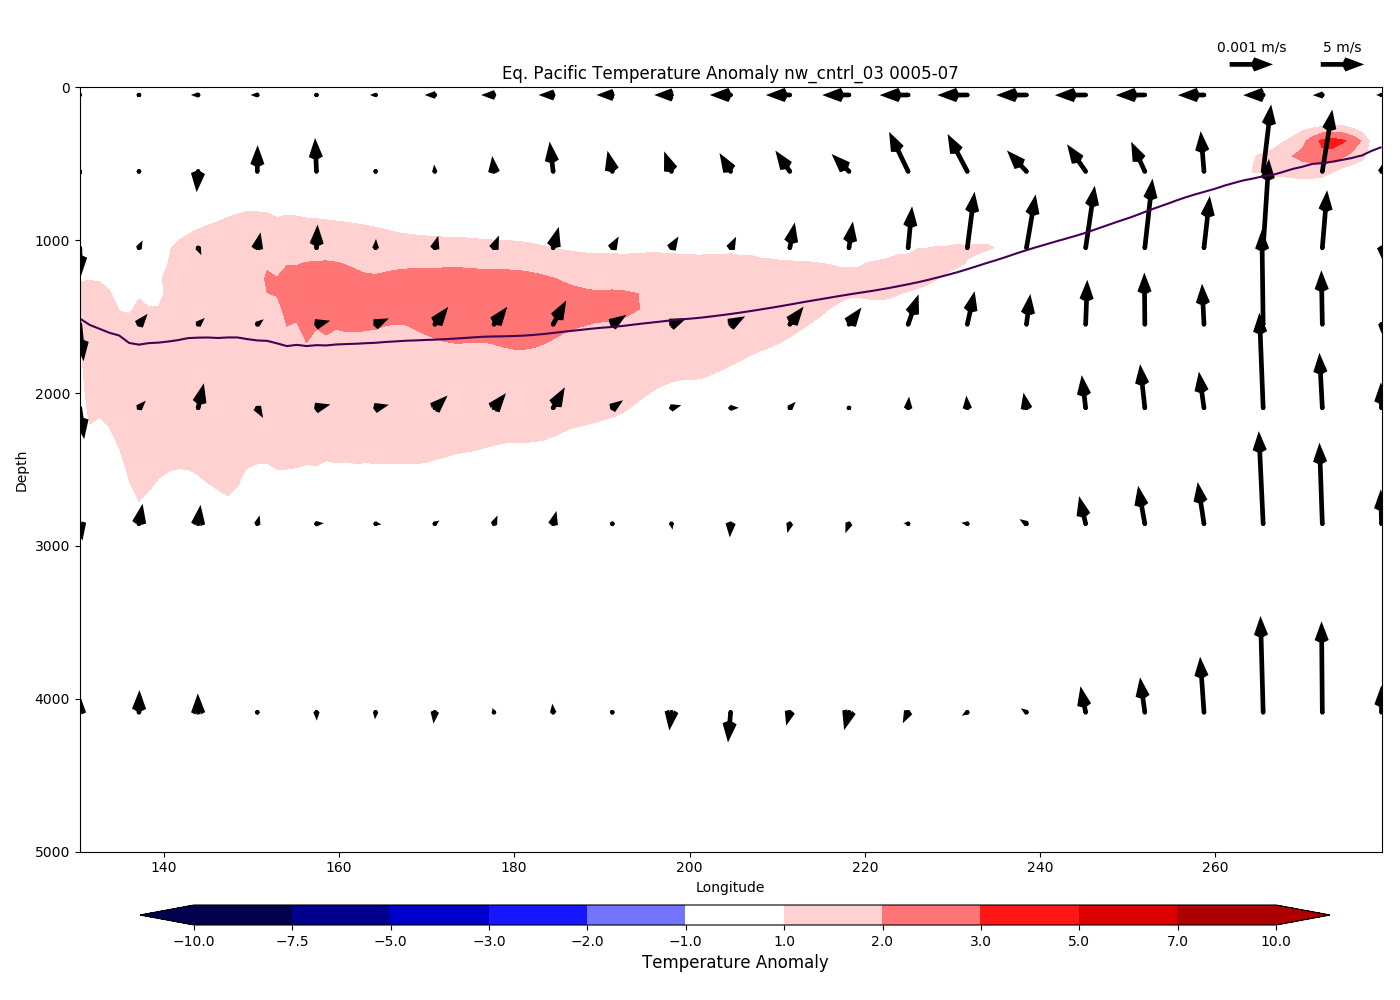
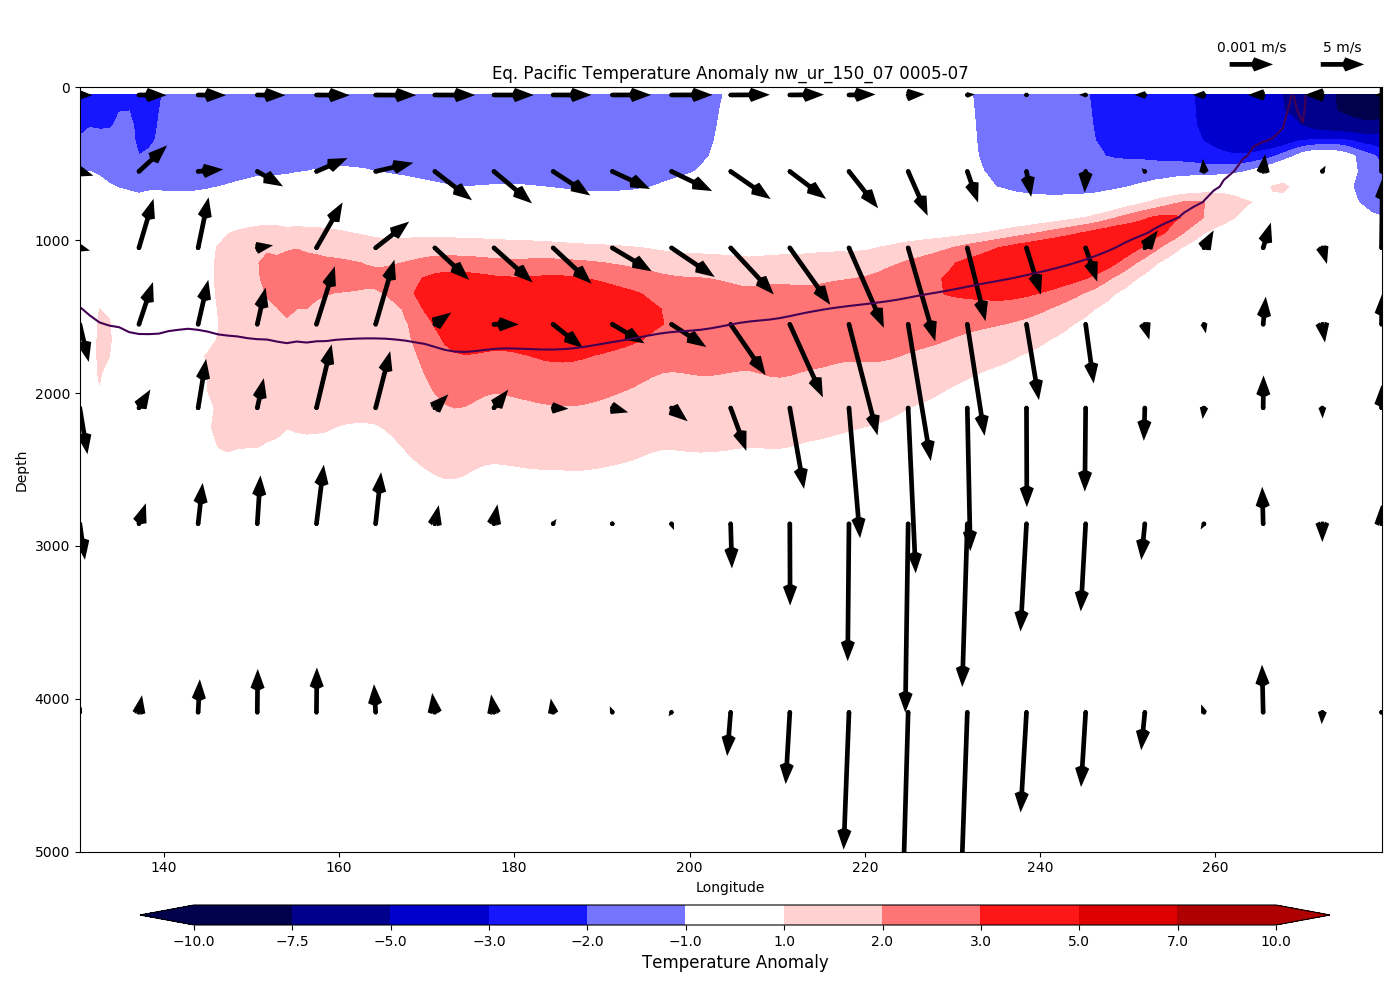
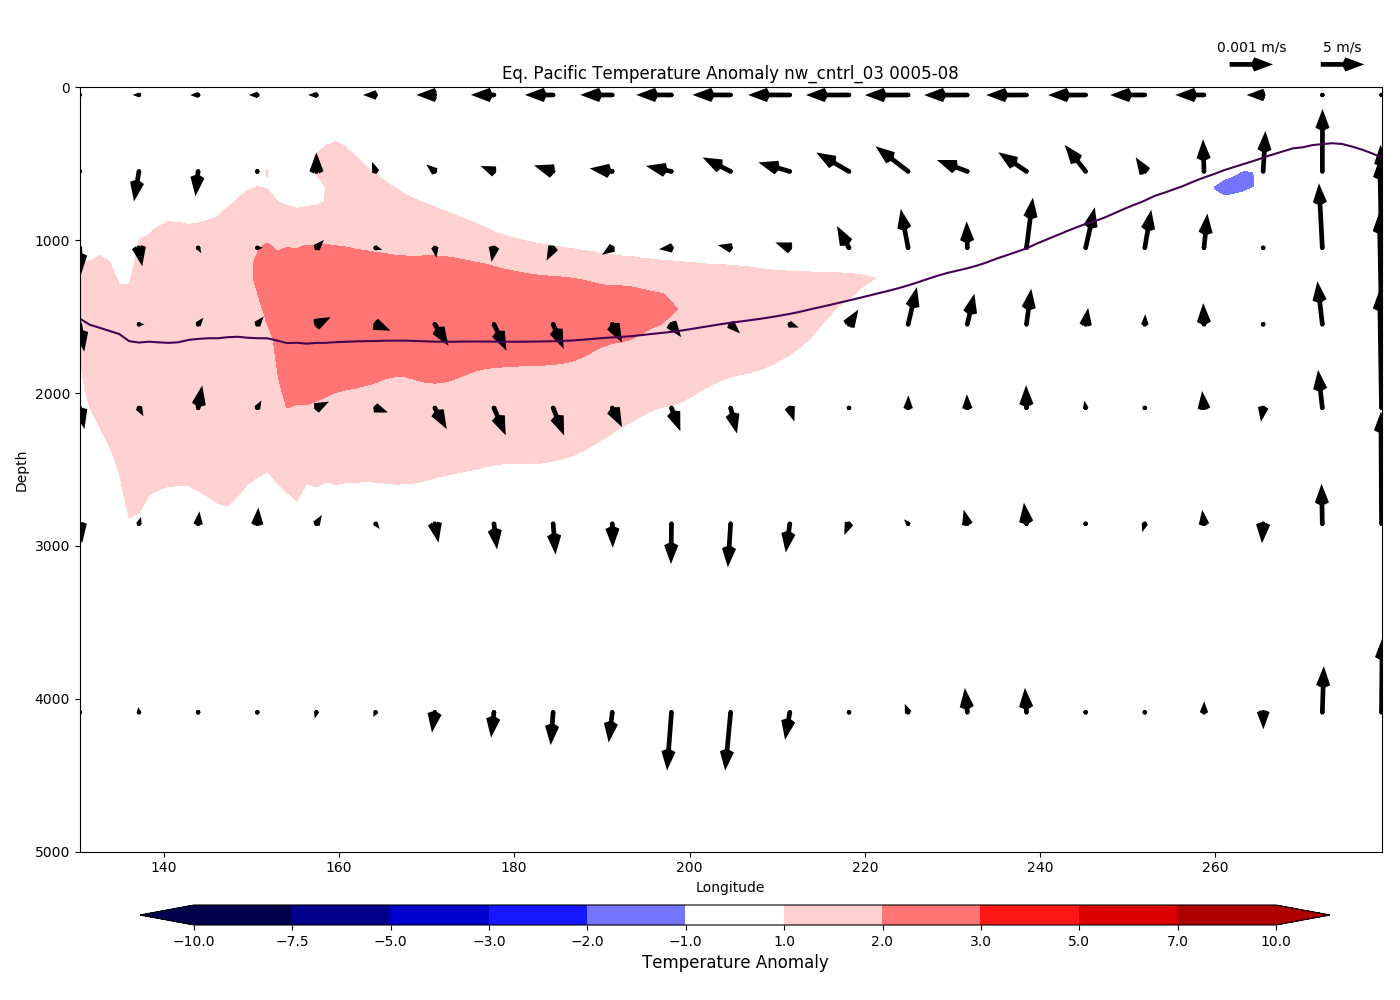
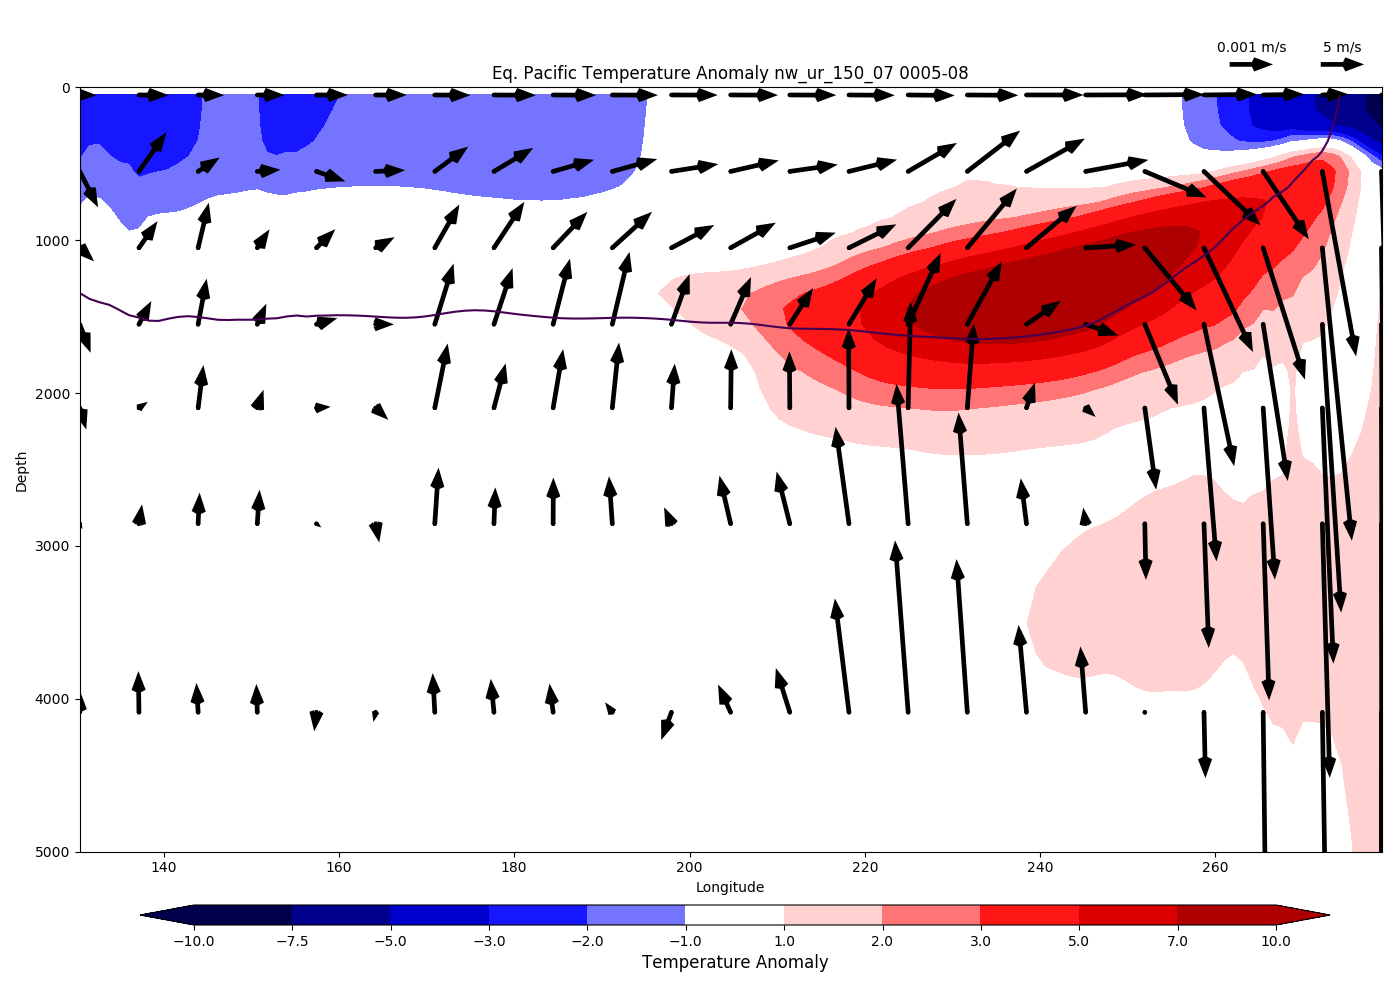
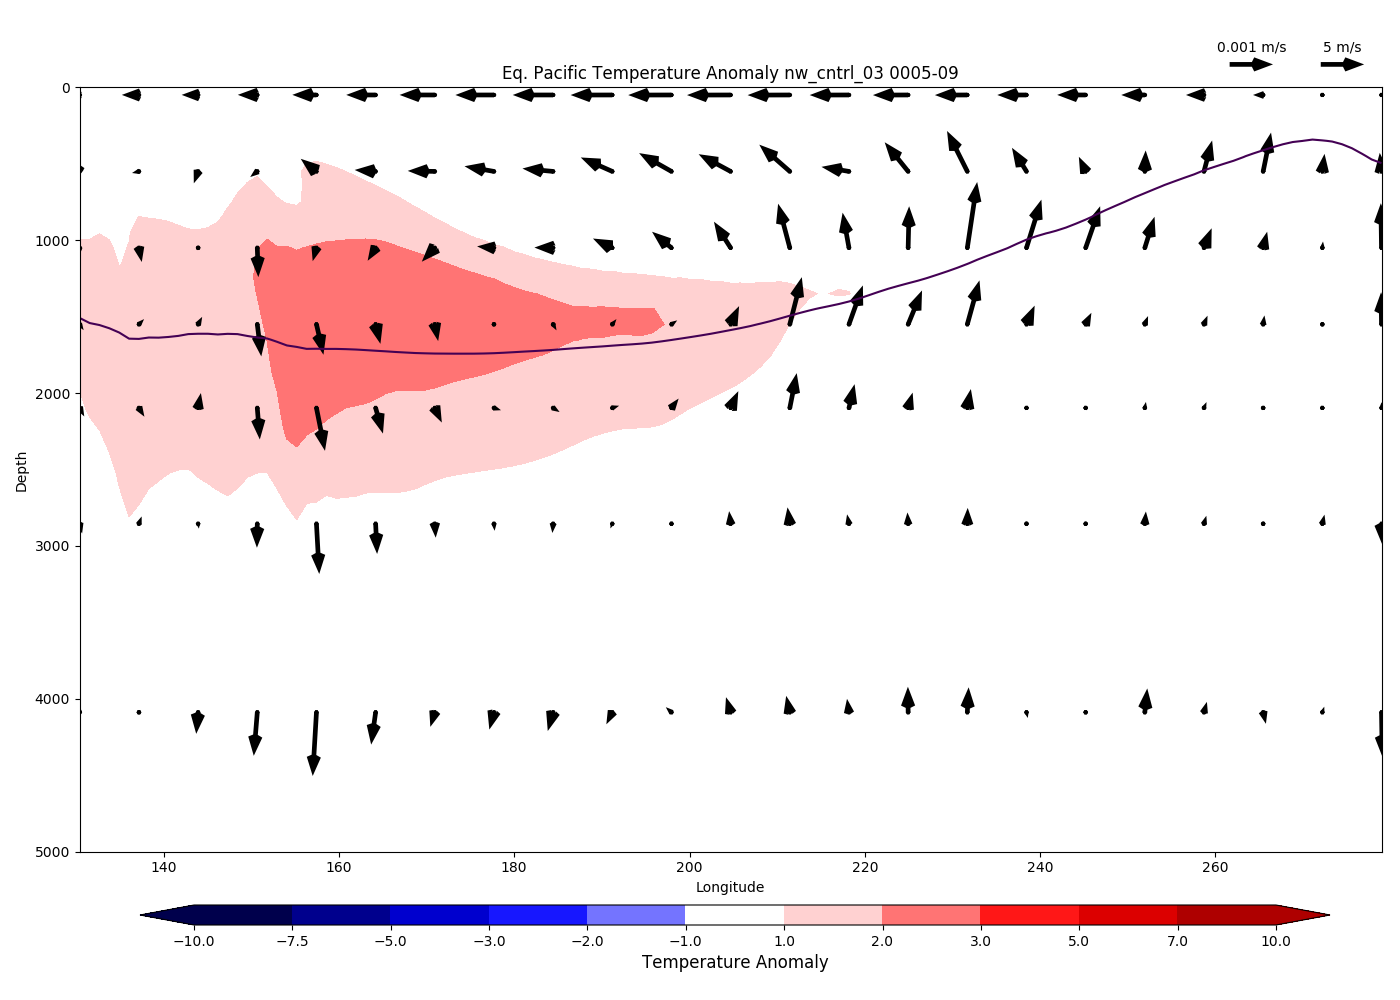
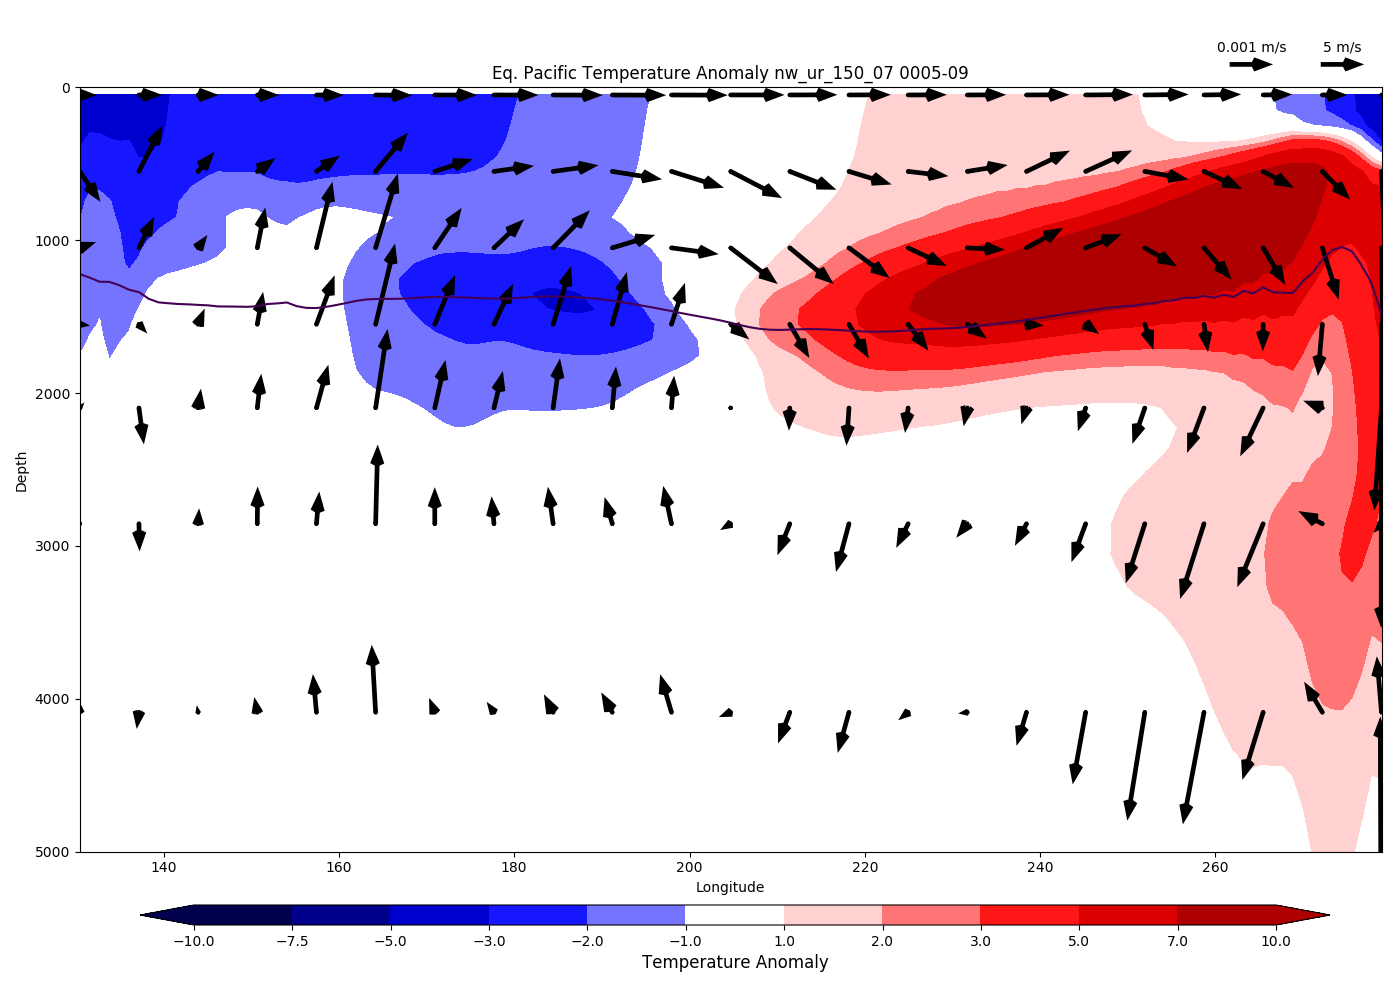
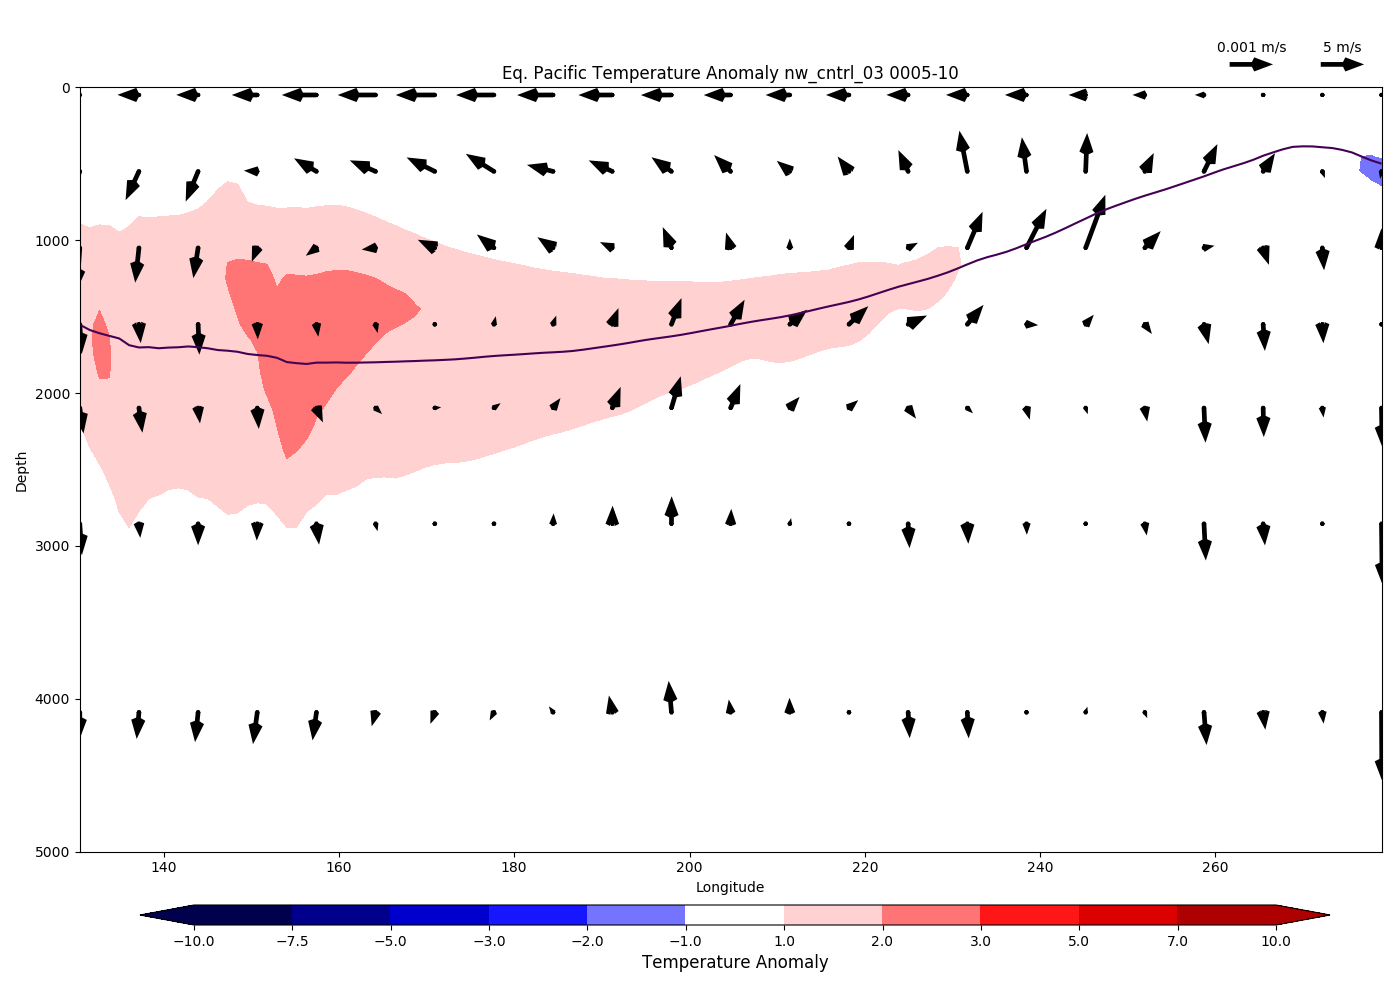
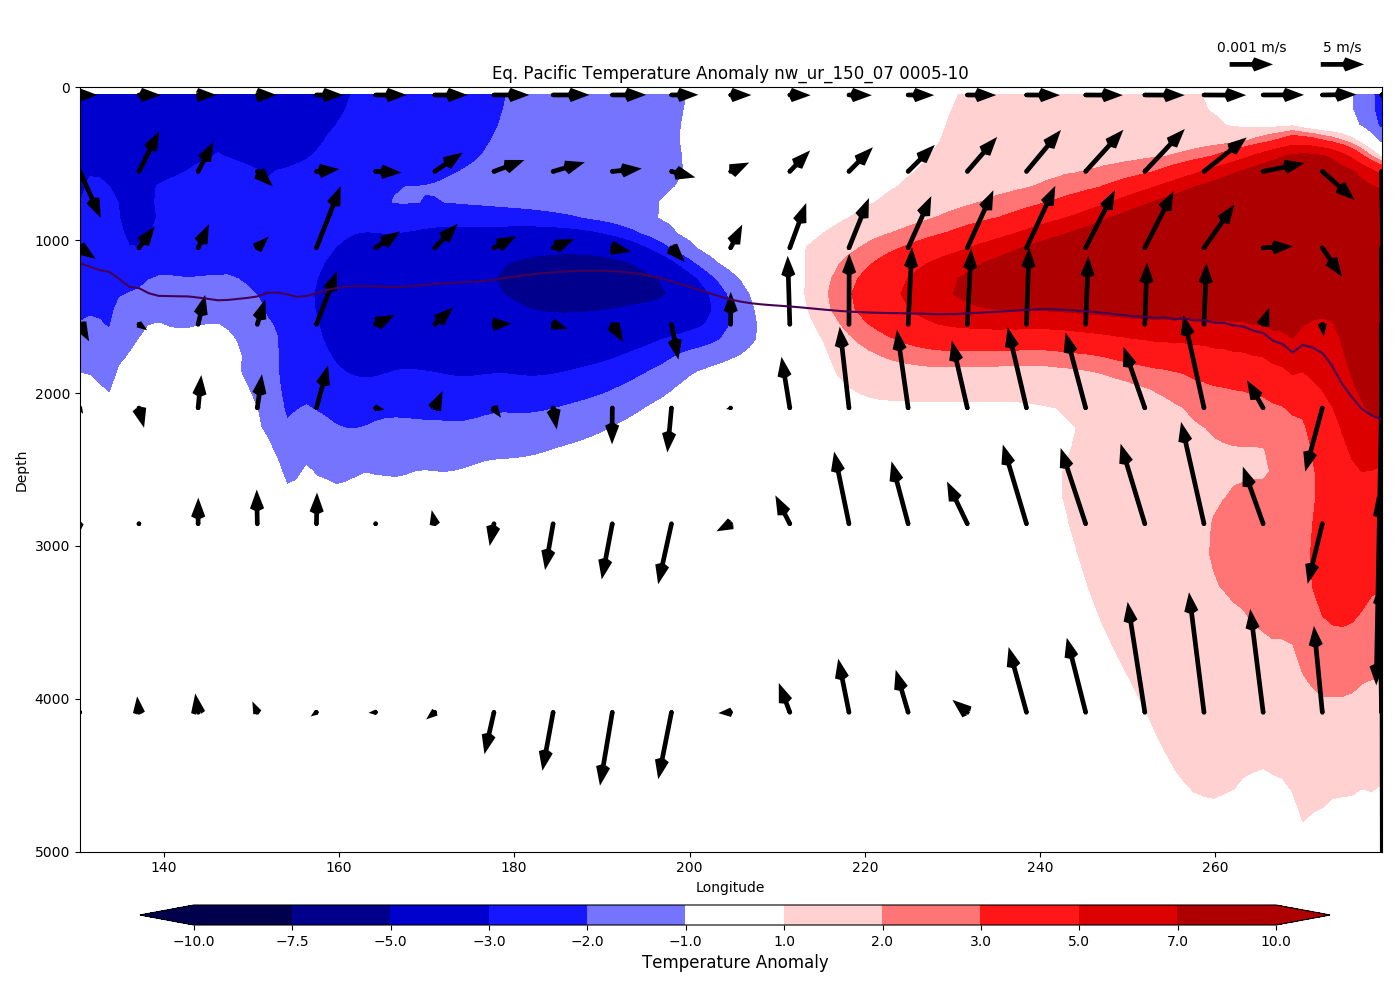
Equatorial Pacific Ocean Temperature Changes During 150 Tg Black Carbon Injection
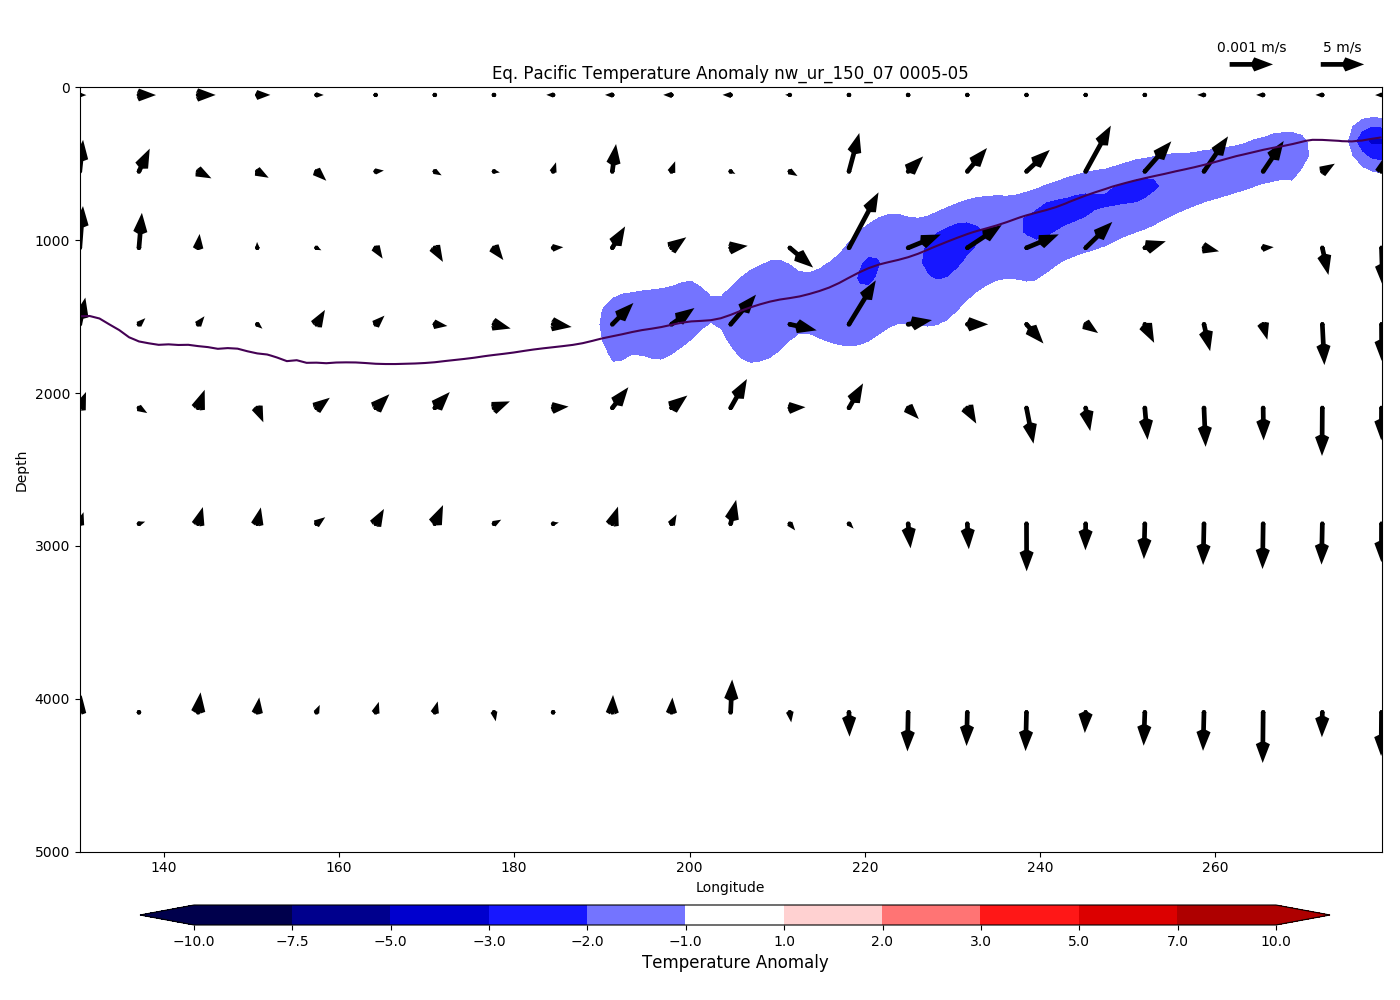
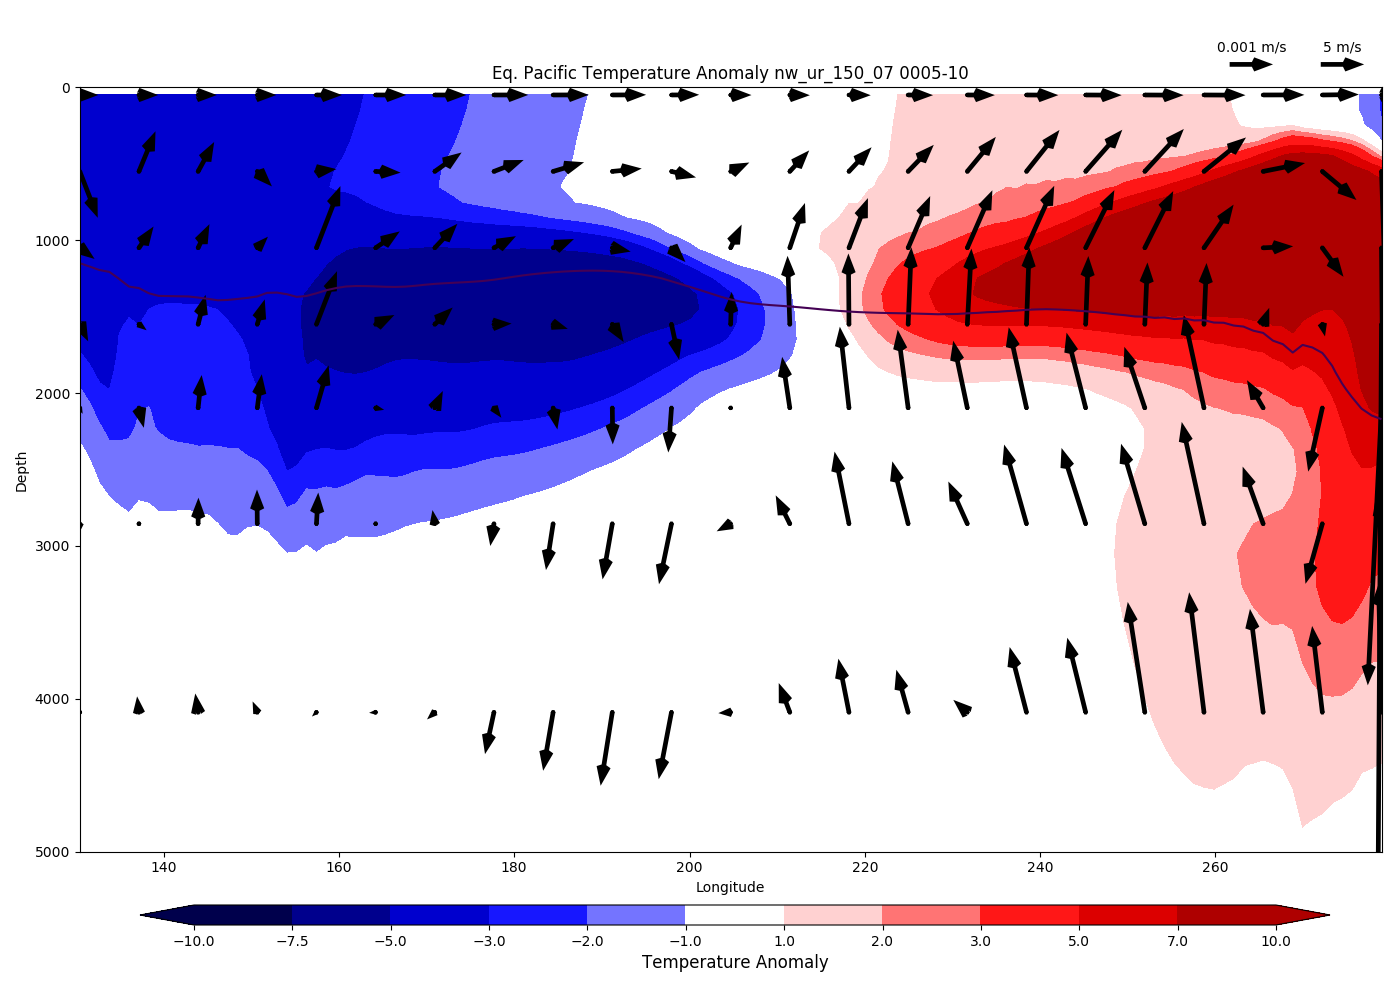
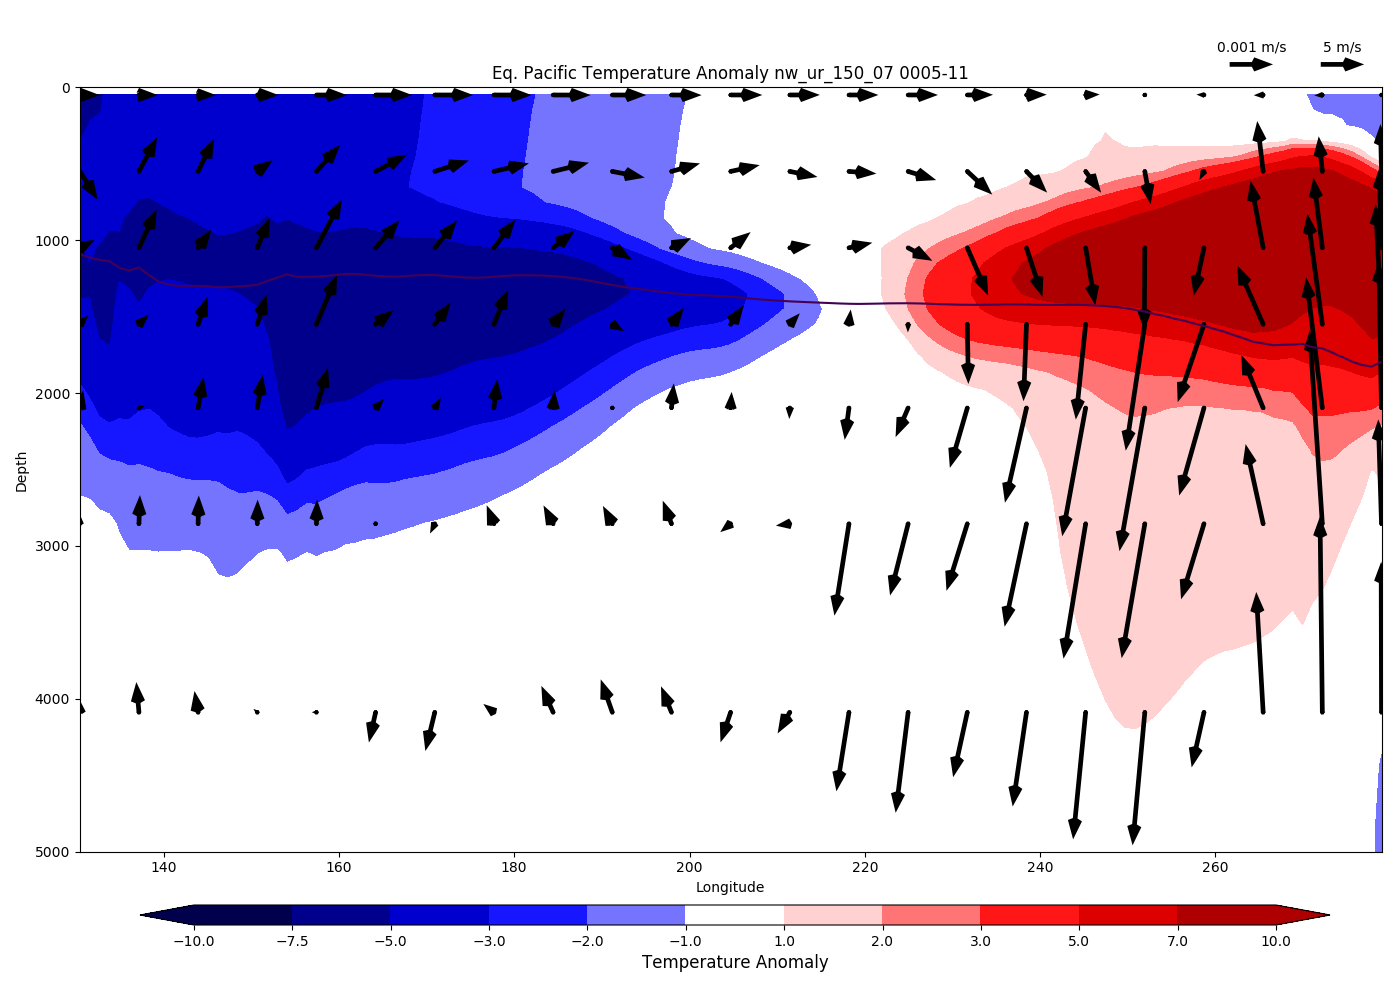
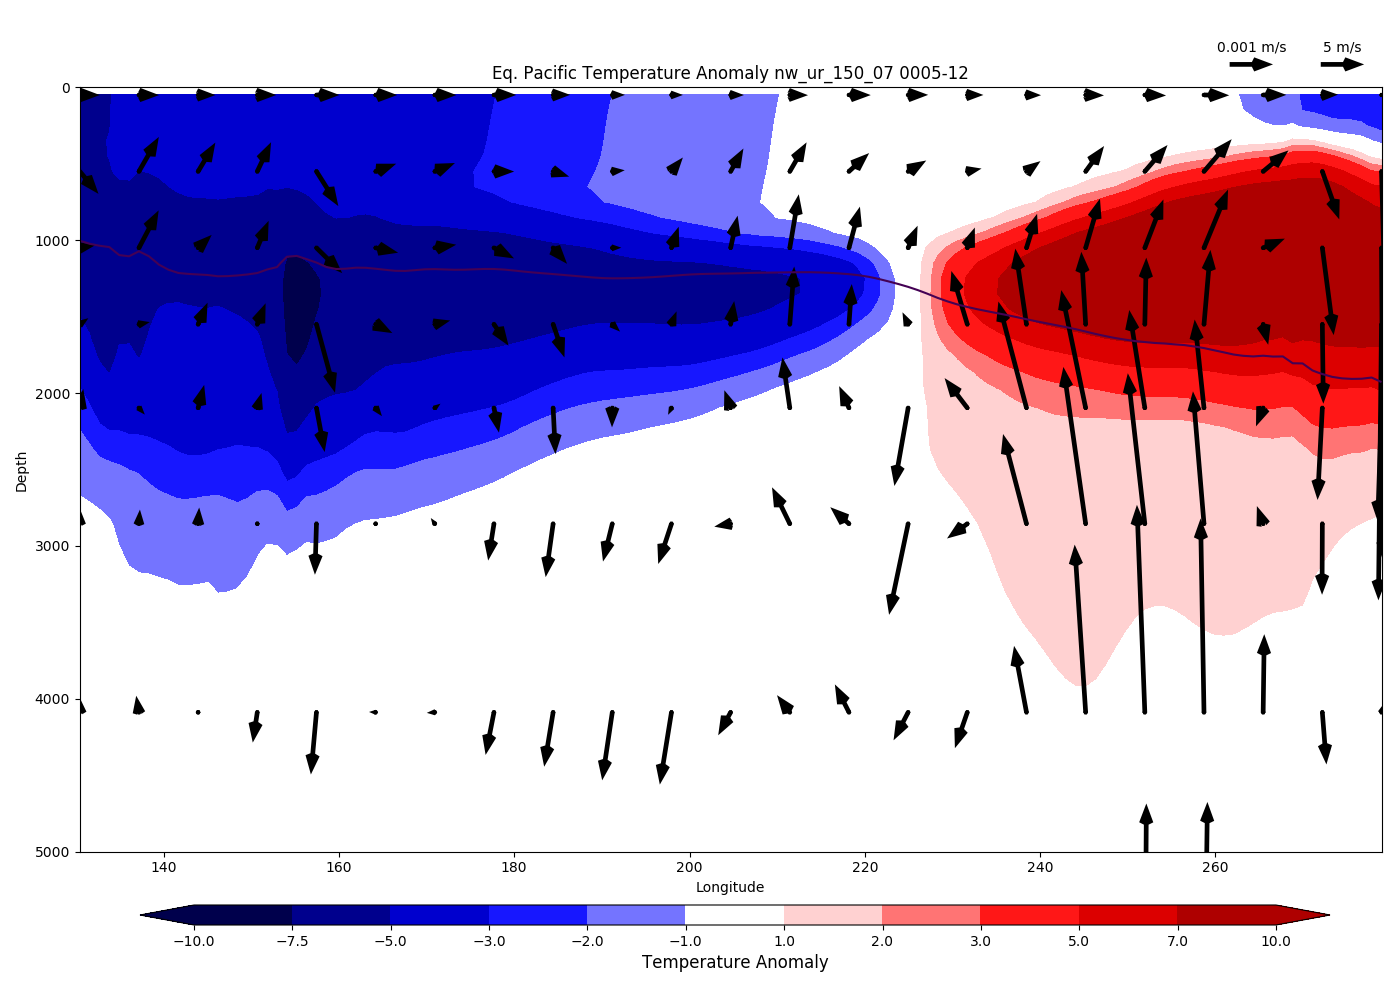
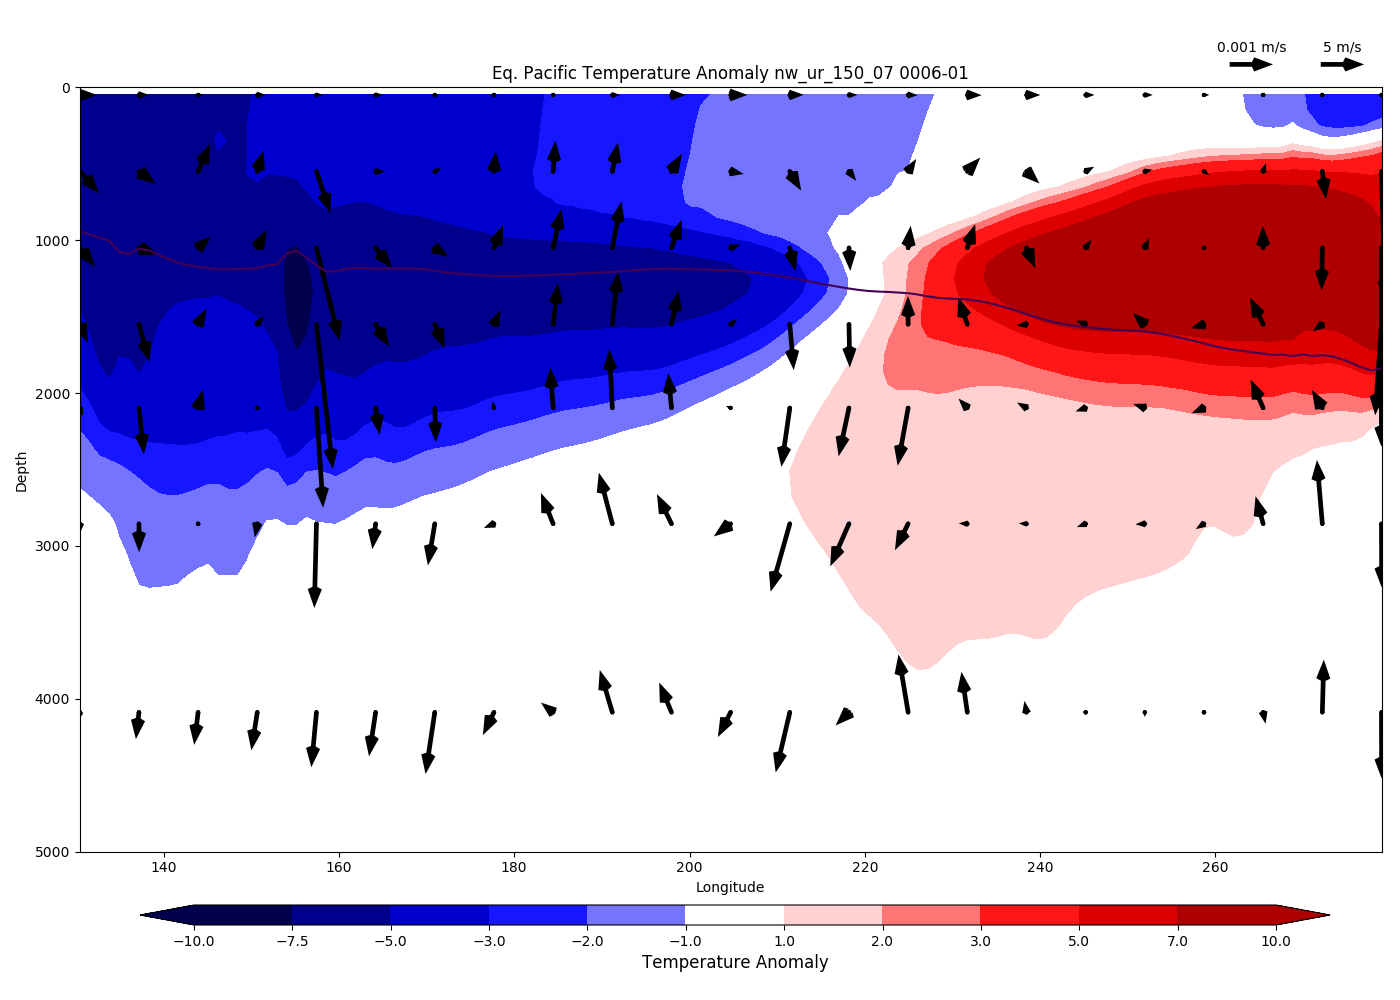
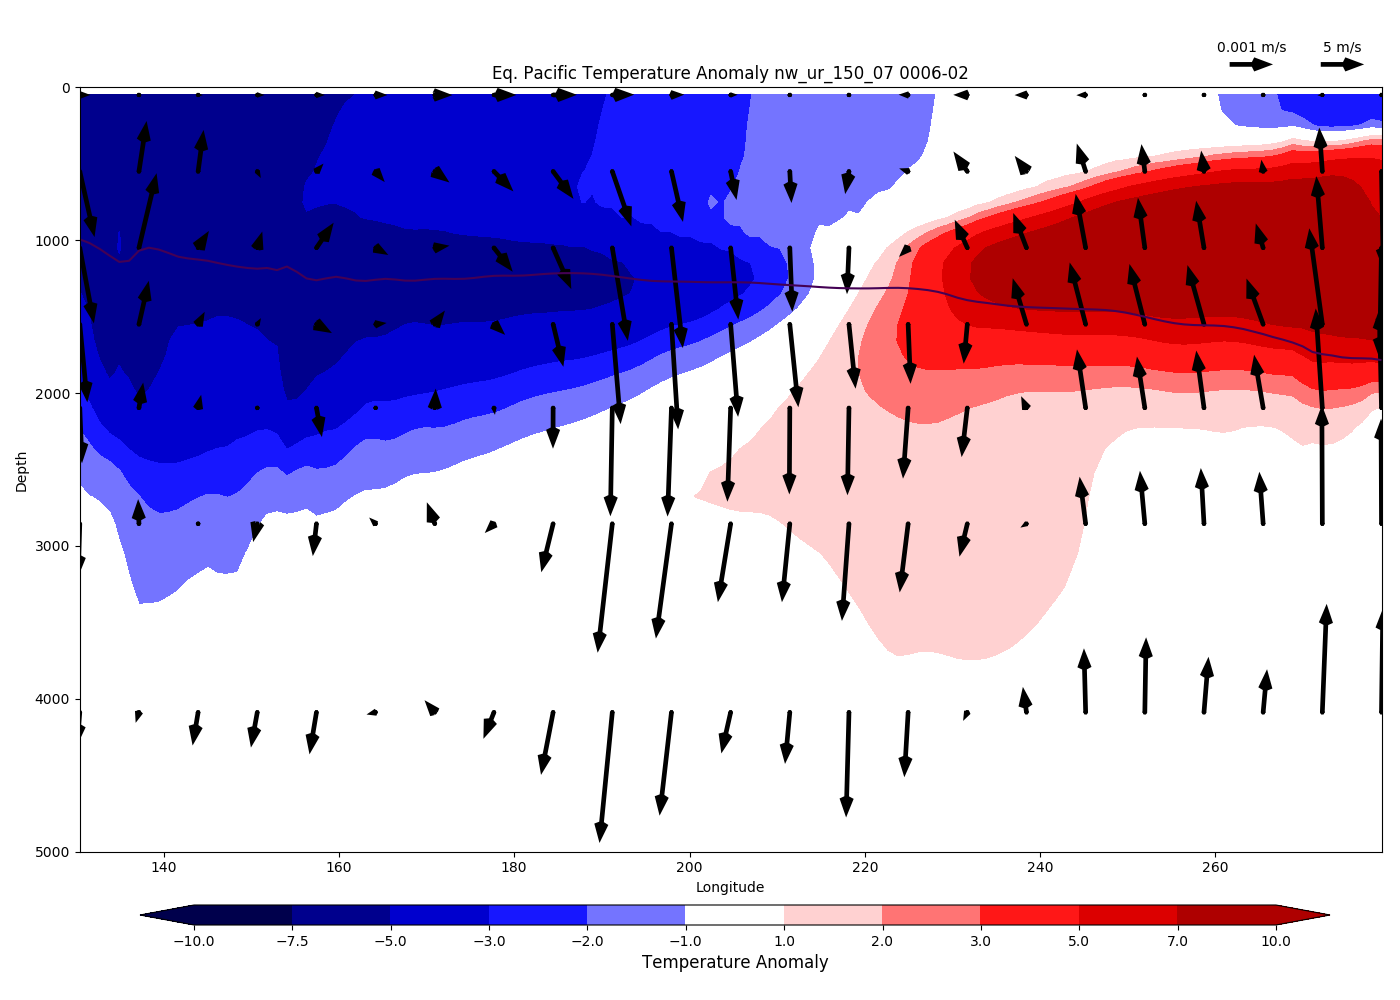
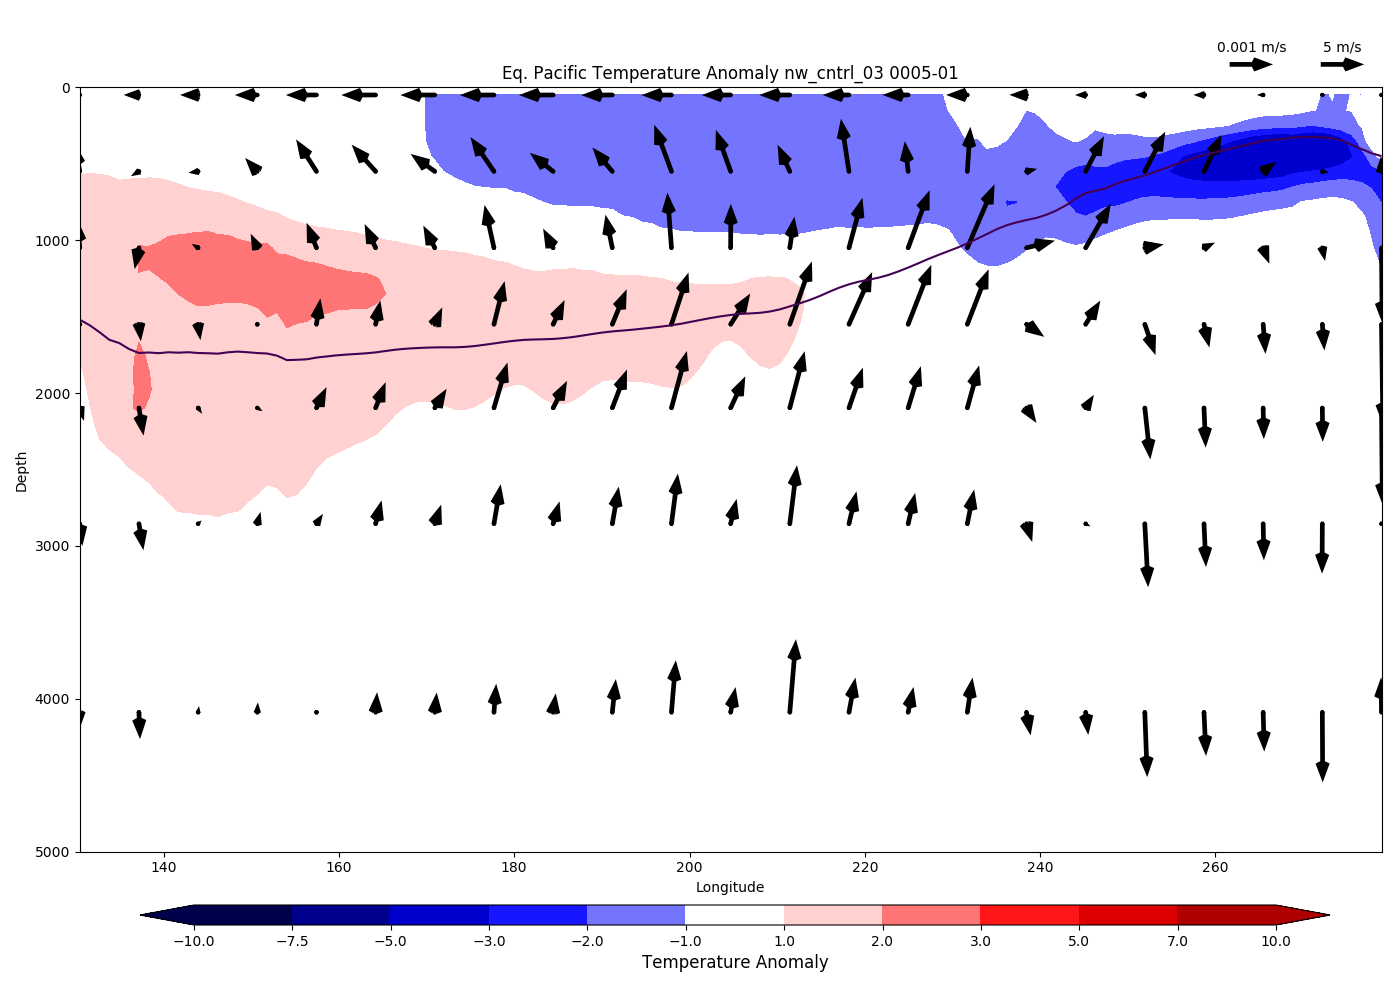
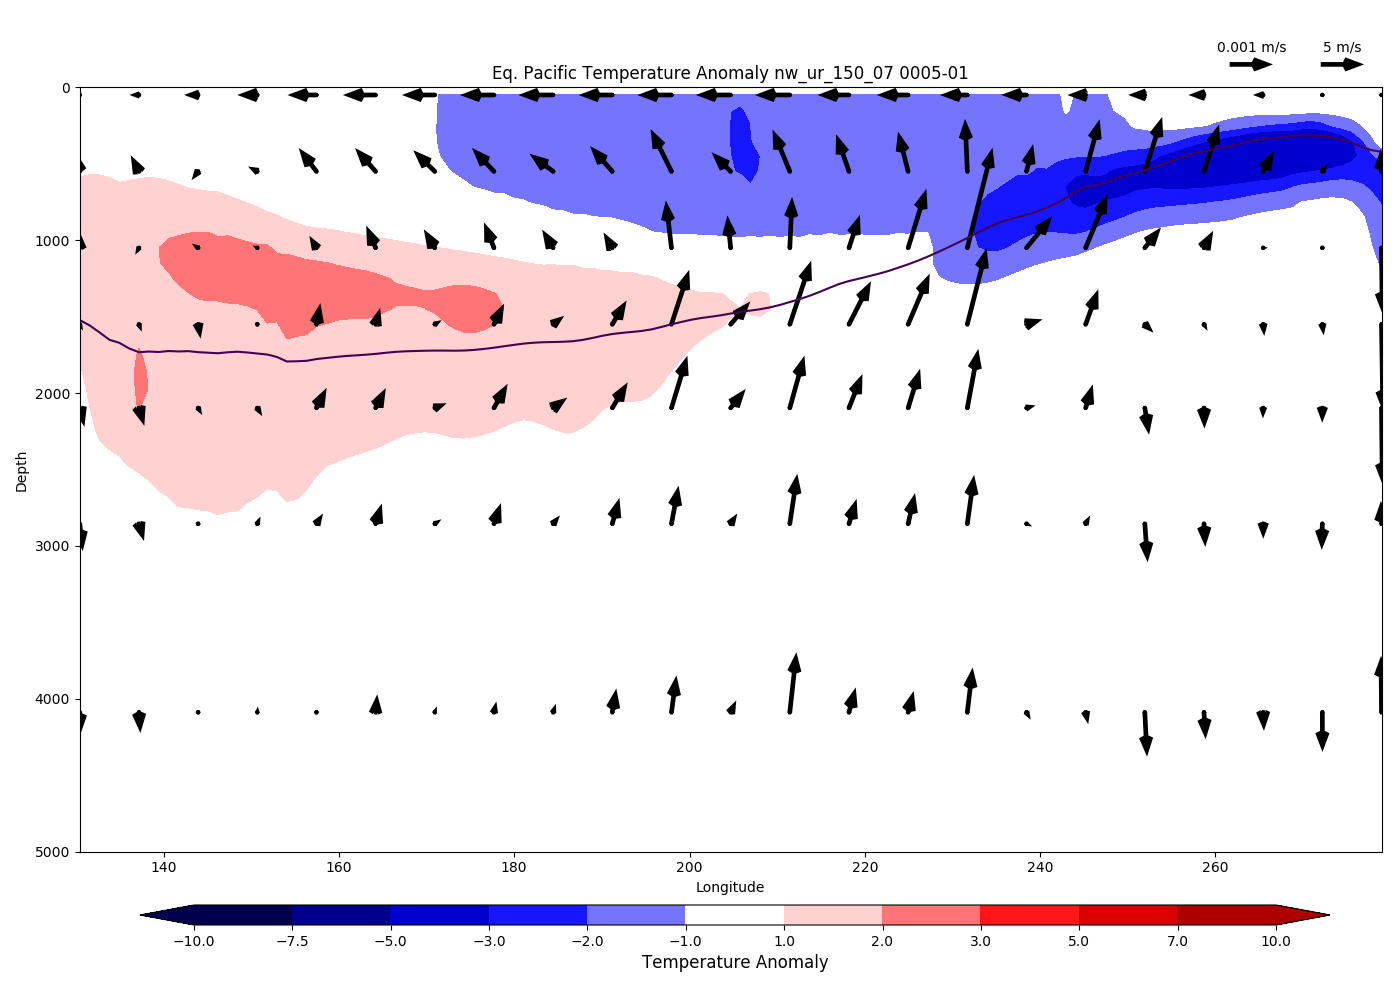
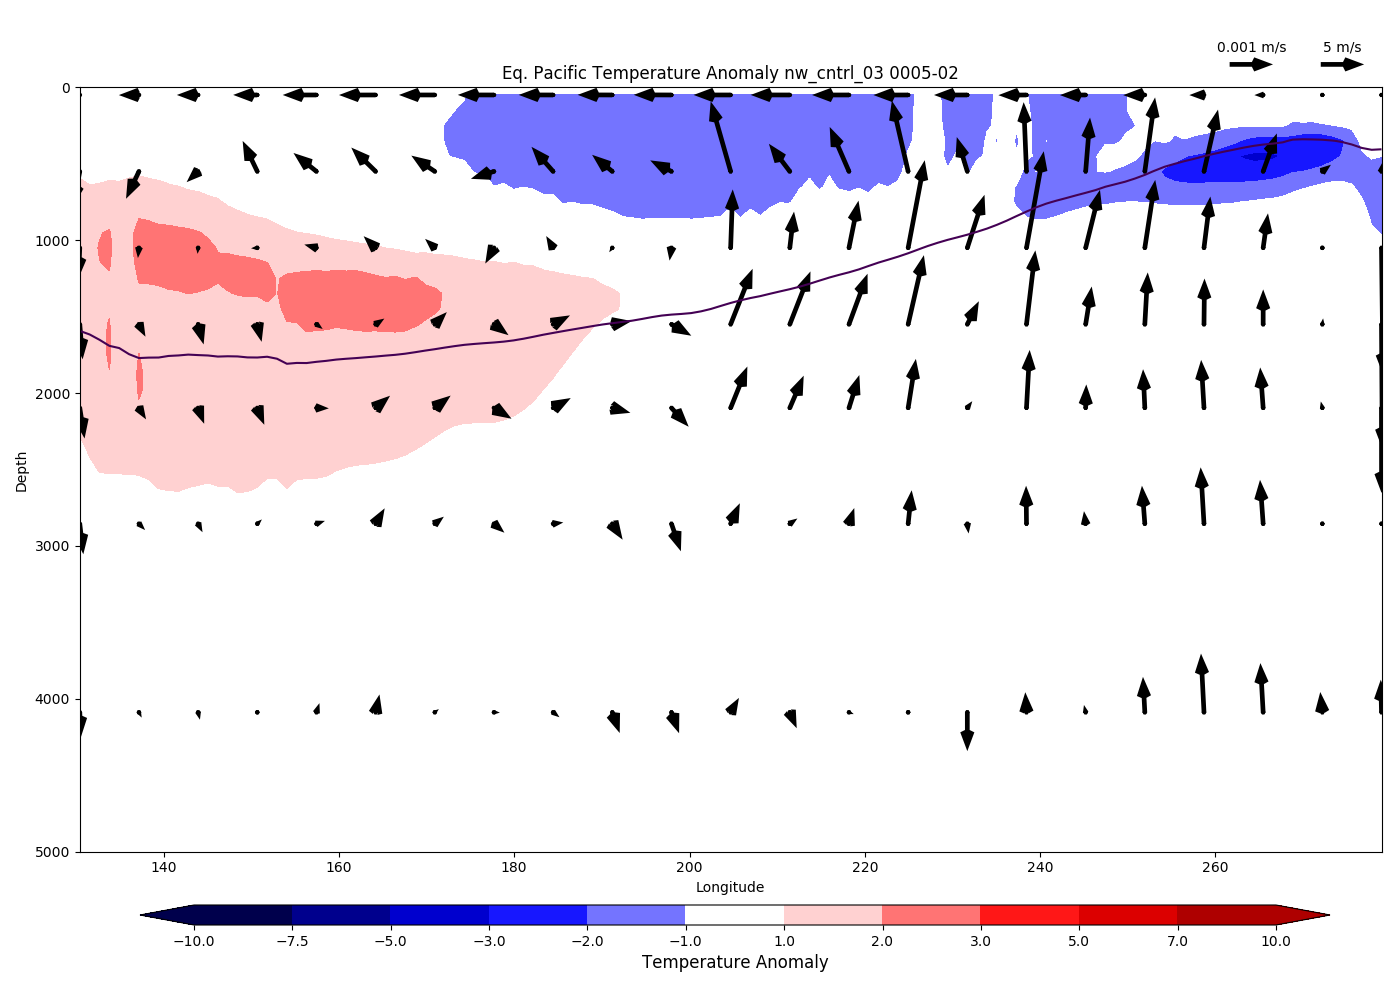
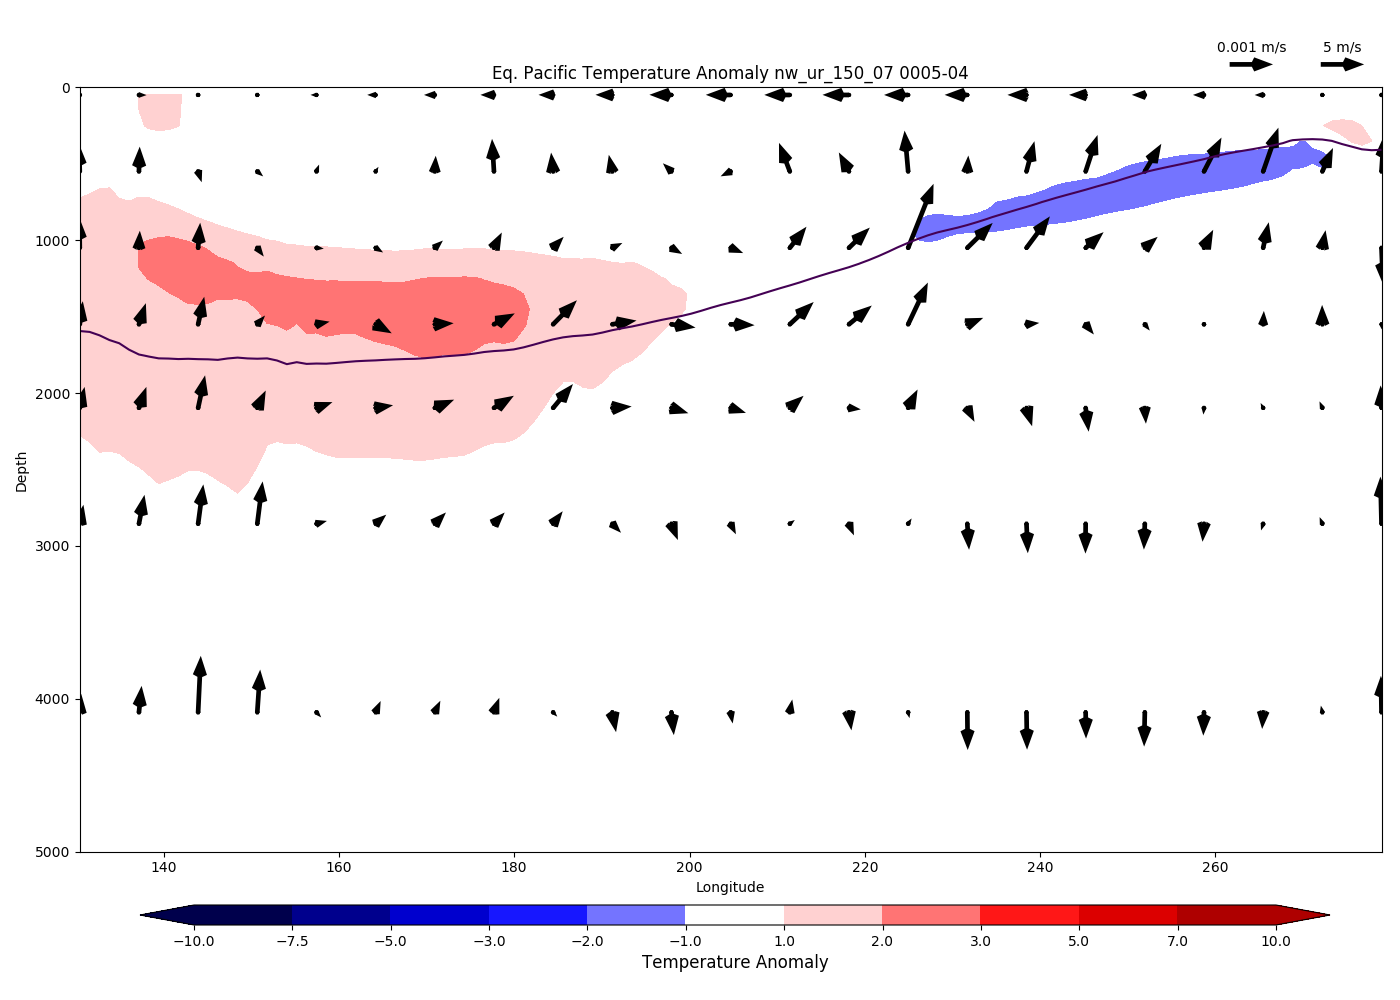
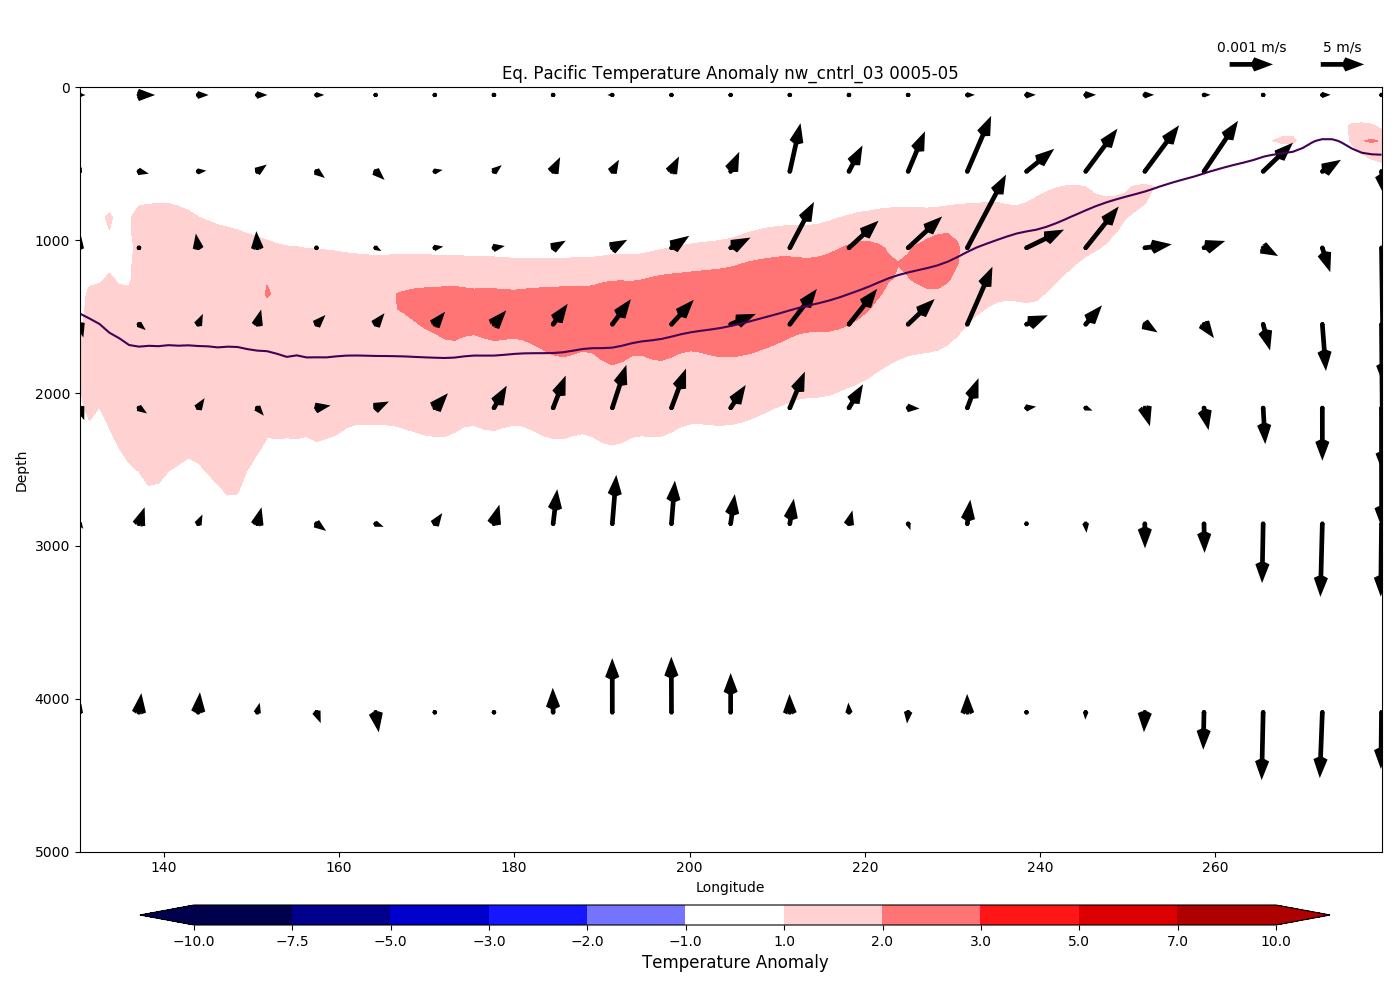
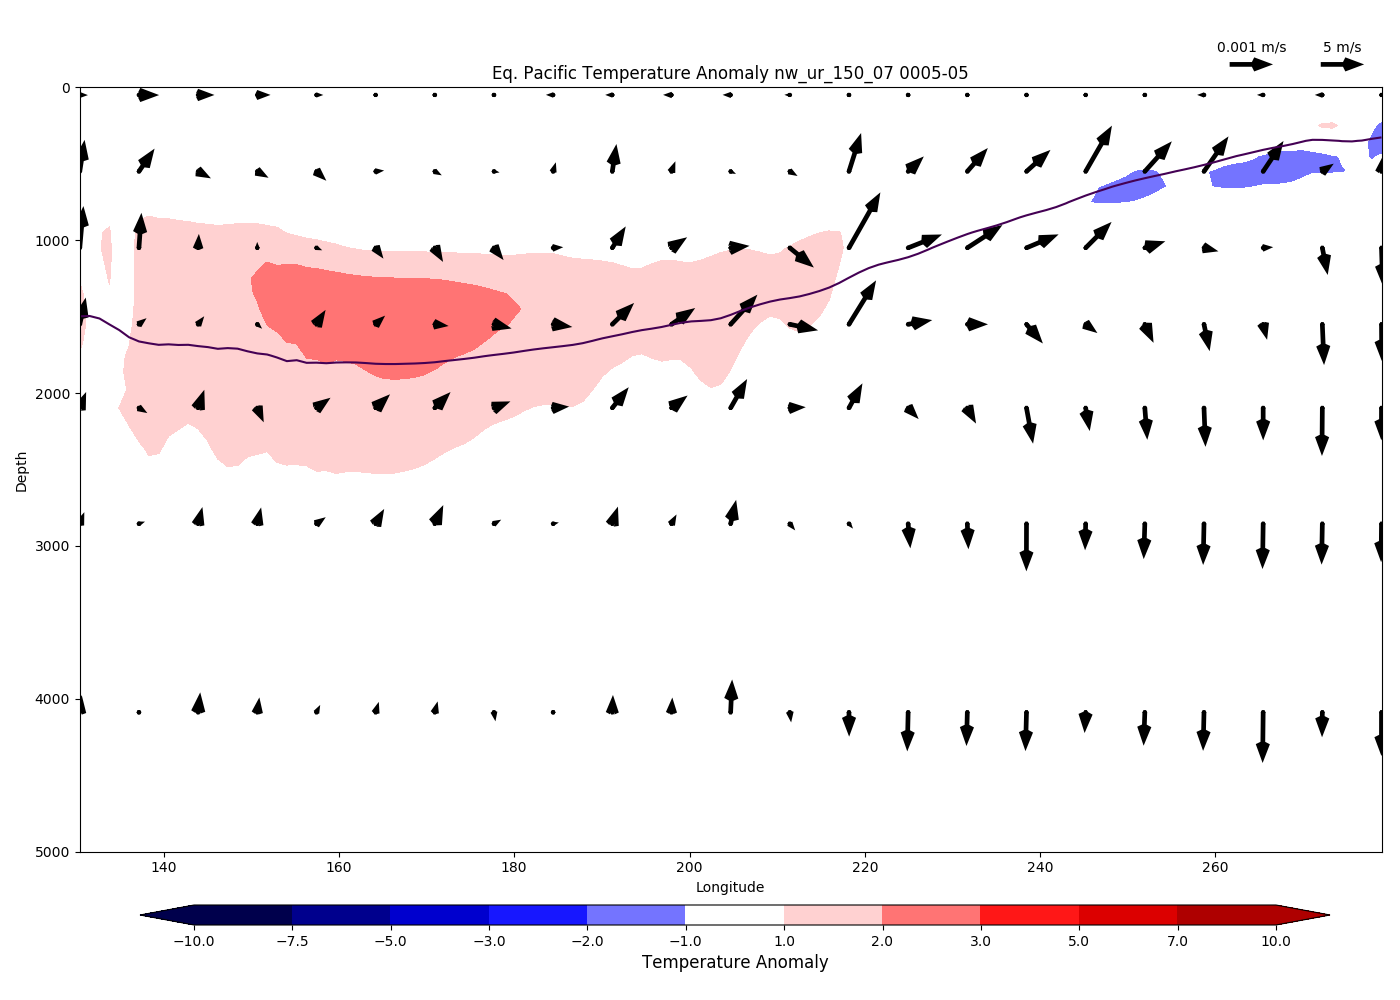
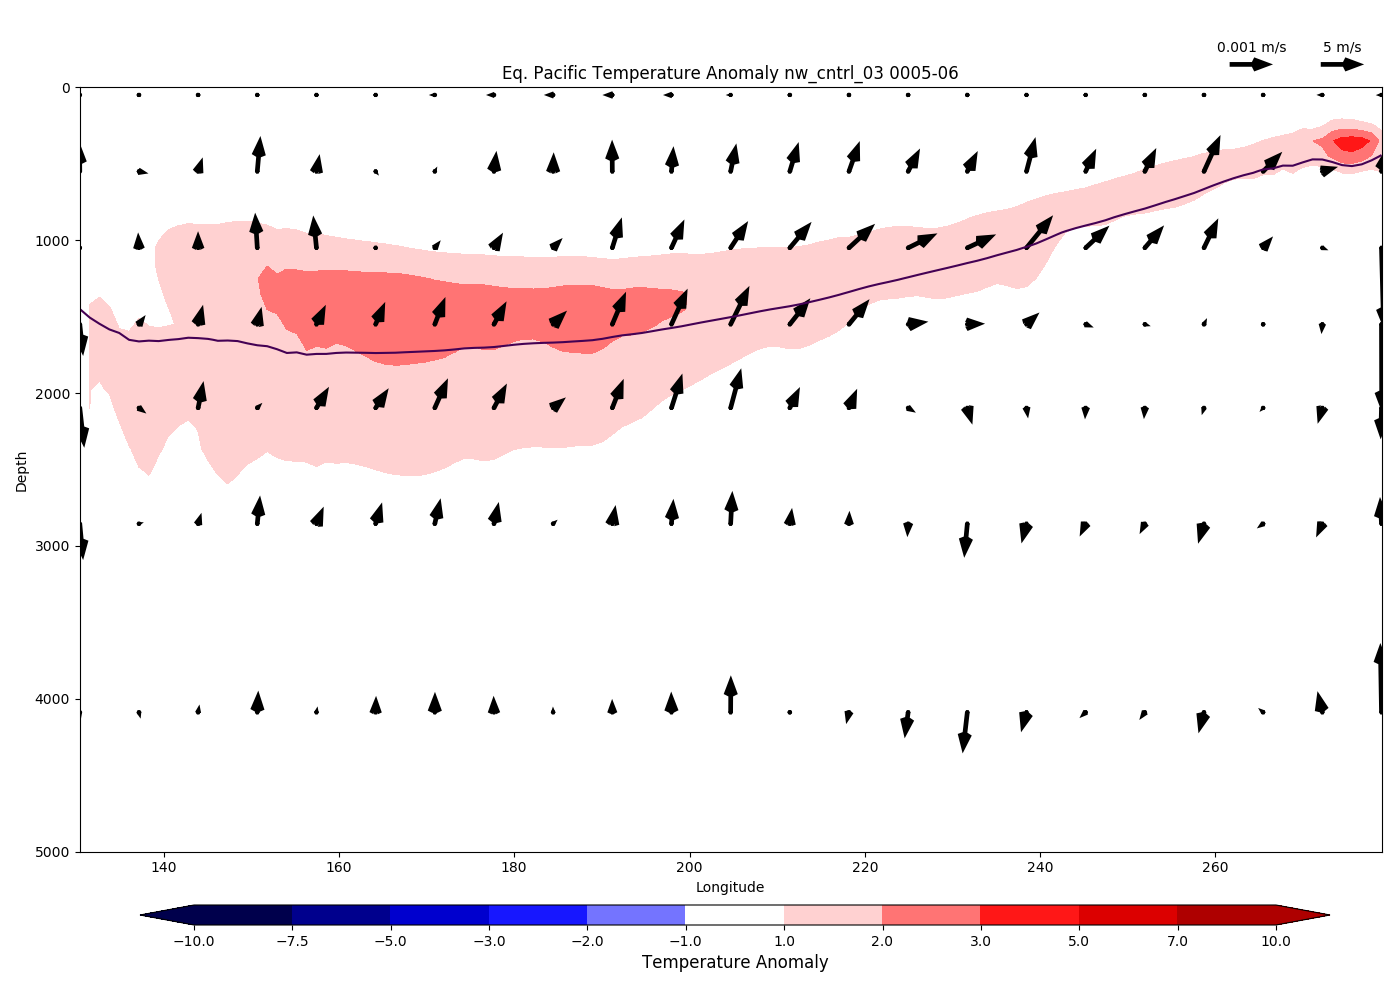
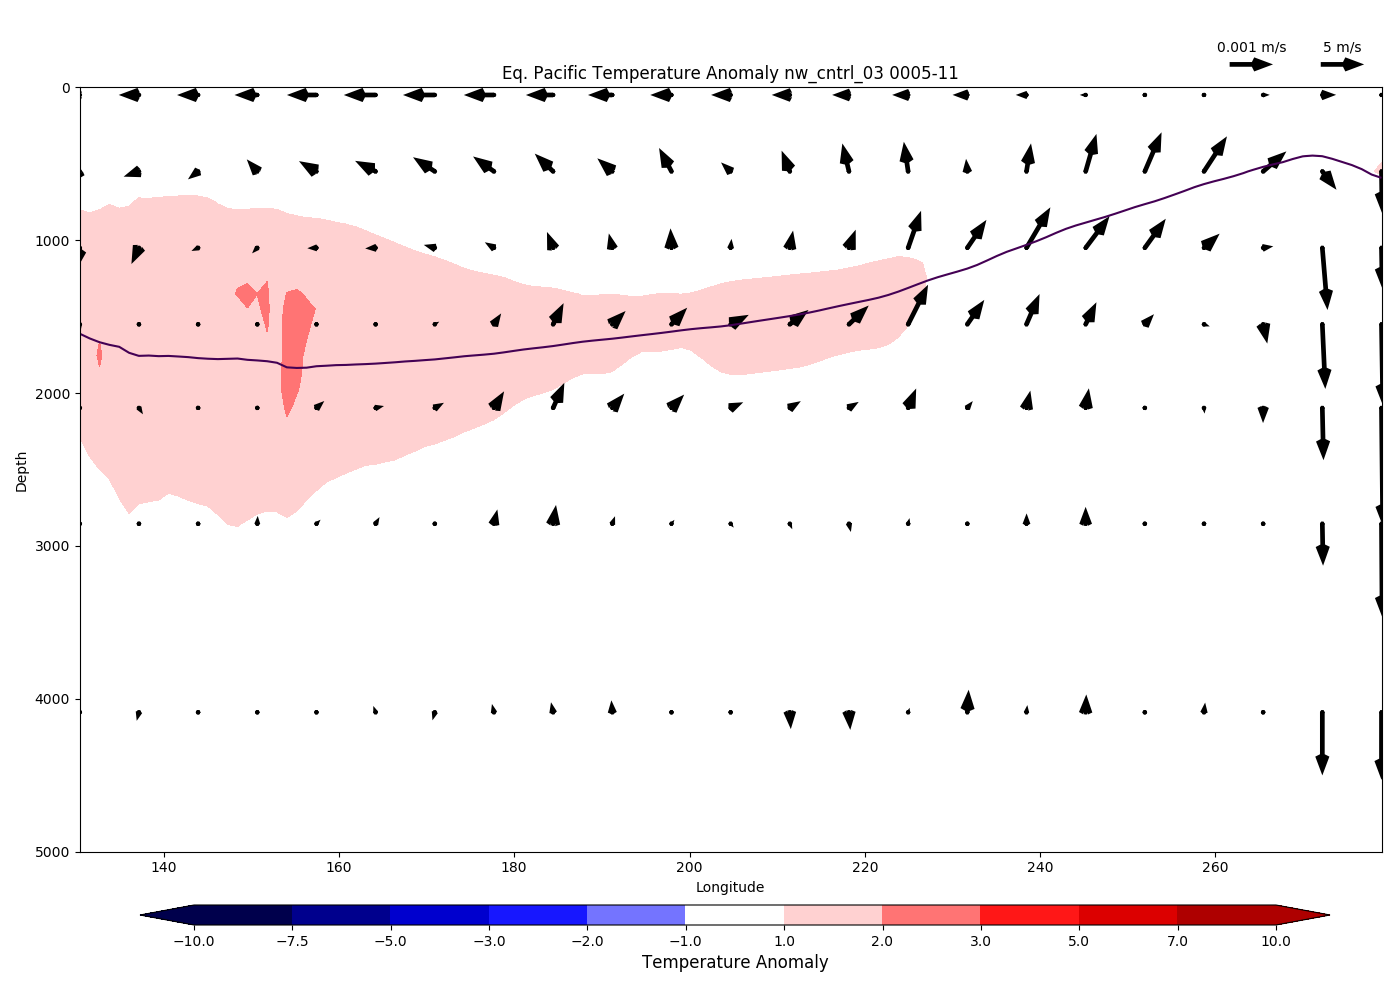
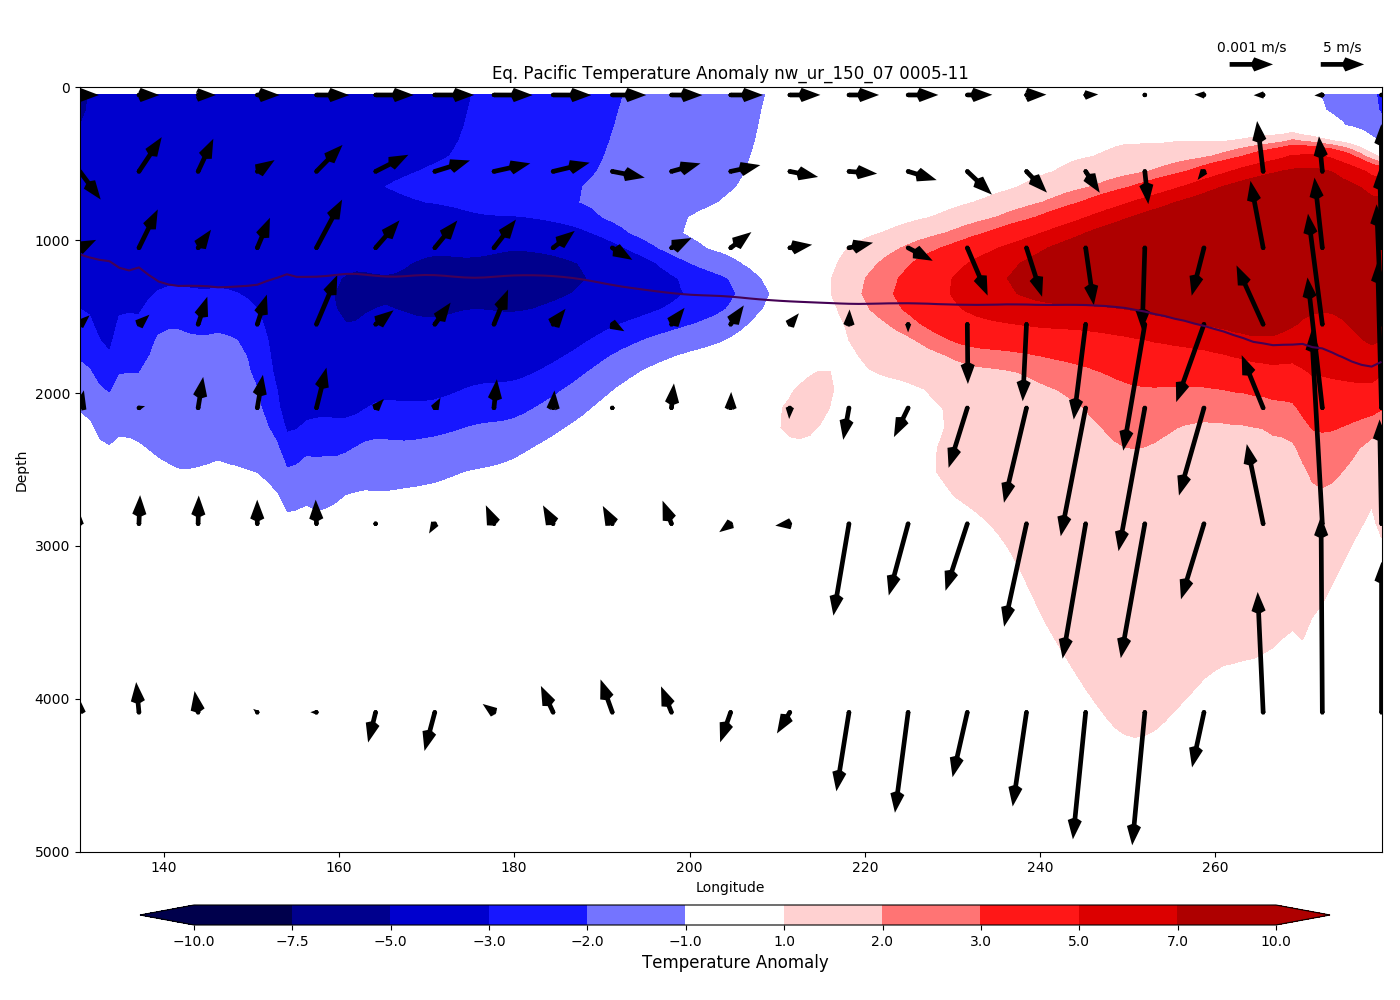
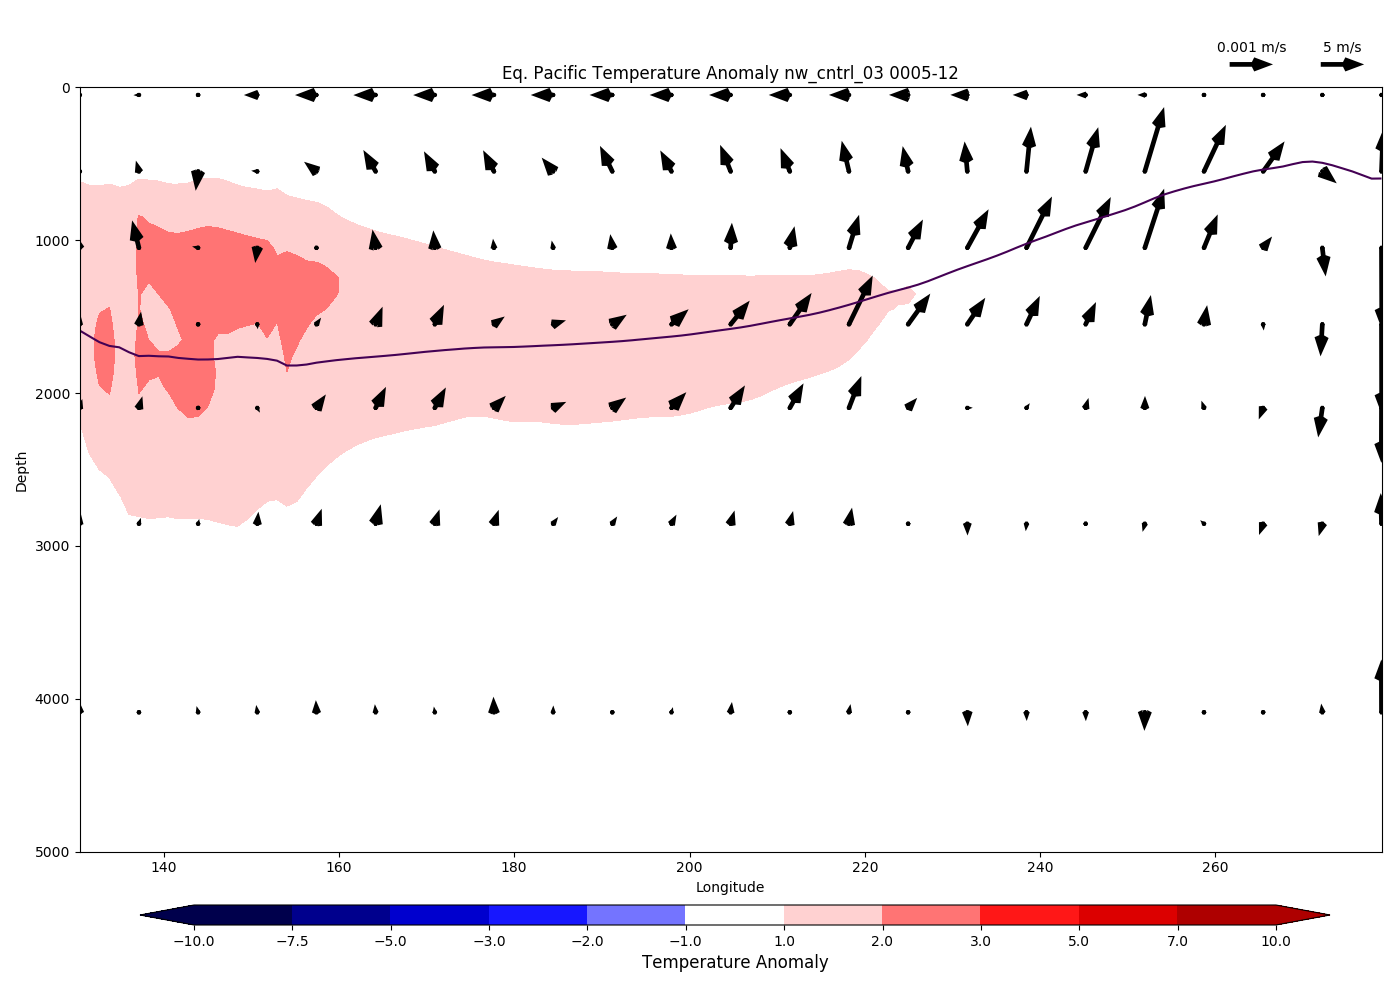
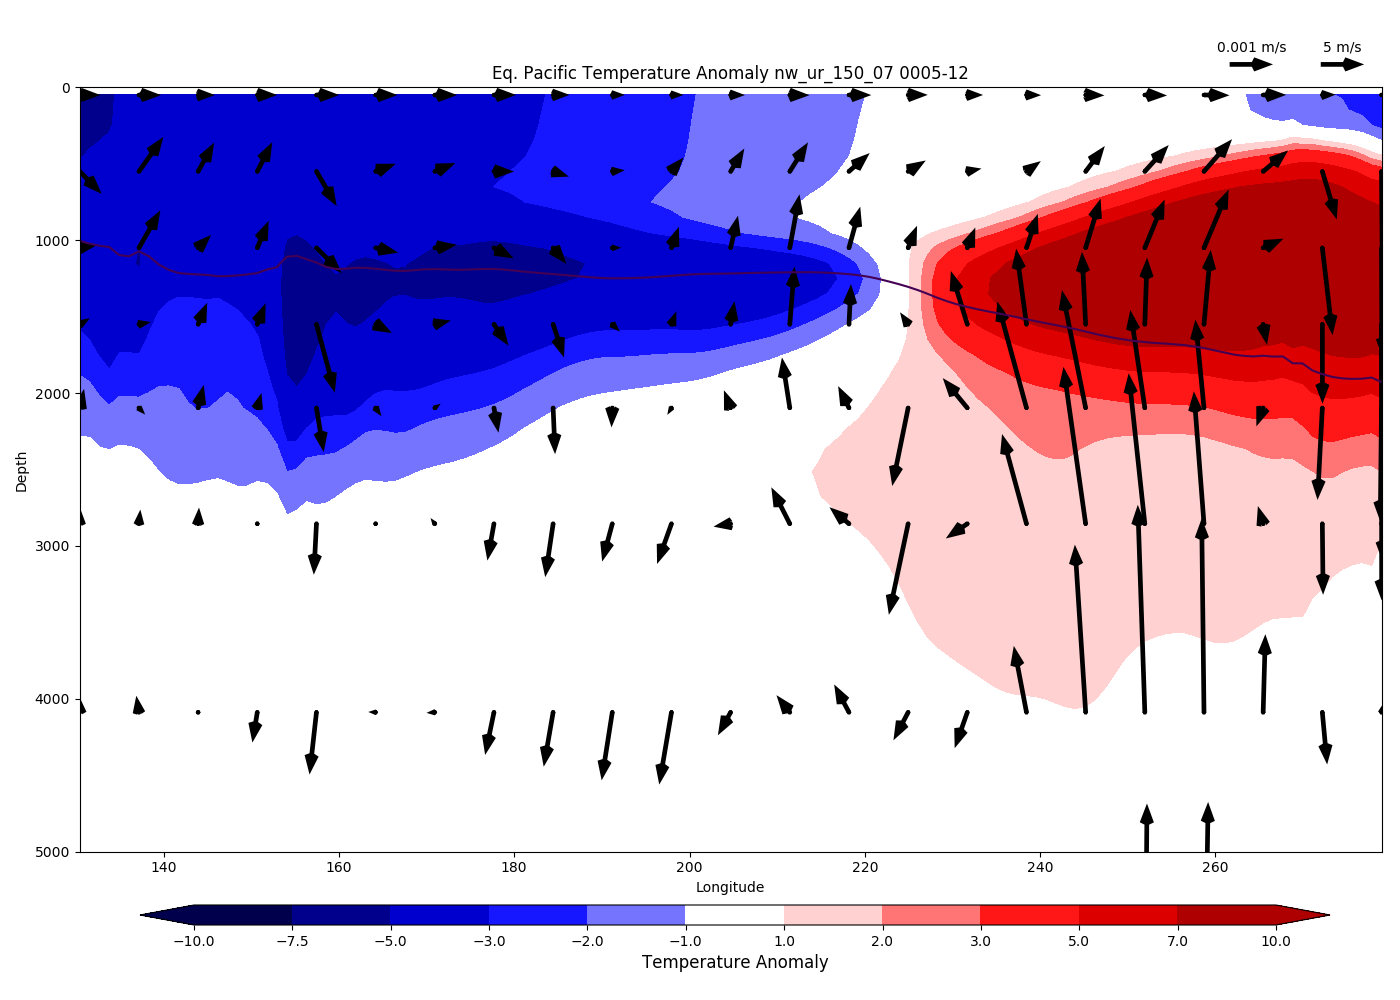
Cross-section plots of the equatorial Pacific ocean temperatures anomalies, zonal, and vertical velocities are shown below for the nw_cntrl_03 control run and nw_ur_150_07 150 Tg black carbon injection. Temperature anomalies are calculated using a climatology from years 0005-0021 of nw_cntrl_03. There is a slight trend in Ocean Heat Content (OHC) in the equatorial Pacific but I don't think it's large enough to impact what these plots illustrate. What is clear is that there is a warm temperature anomaly in the Western Pacific Warm Pool at depth at the beginning of nw_cntrl_03 and nw_ur_150_07, which may be unintentionally priming the nw_ur_150_07 for an El Nino after cooling from the stratospheric black carbon injection triggers a Westerly Wind Burst (WWB) in the Western Pacific.
It is worth noting that an El Nino does NOT develop in nw_cntrl_03 despite ample warm water in the Western Pacific which starts to propagate eastward but does NOT make it to the surface during the autumn of year 0005, like in the nw_ur_150_07 case. There is an acceleration of the trade winds (more easterly) that inhibit the development of an El Nino in the control until the next Fall.
5 Tg nw_cntrl_03m02 vs nw_targets_01m02 comparison
5 Tg nw_cntrl_03m03 vs nw_targets_01m03 comparison
nw_cntrl_03_______________________________________________________||||||___nw_ur_150_07
|
|
|
|
|
|
|
|
|
|
|
|
|
|
|
|
|
|
|
|
|
|
|
|
|
|
|
|
|
|
|
|
|
|
|
|
… Working out other ways to calculate anomalies ...
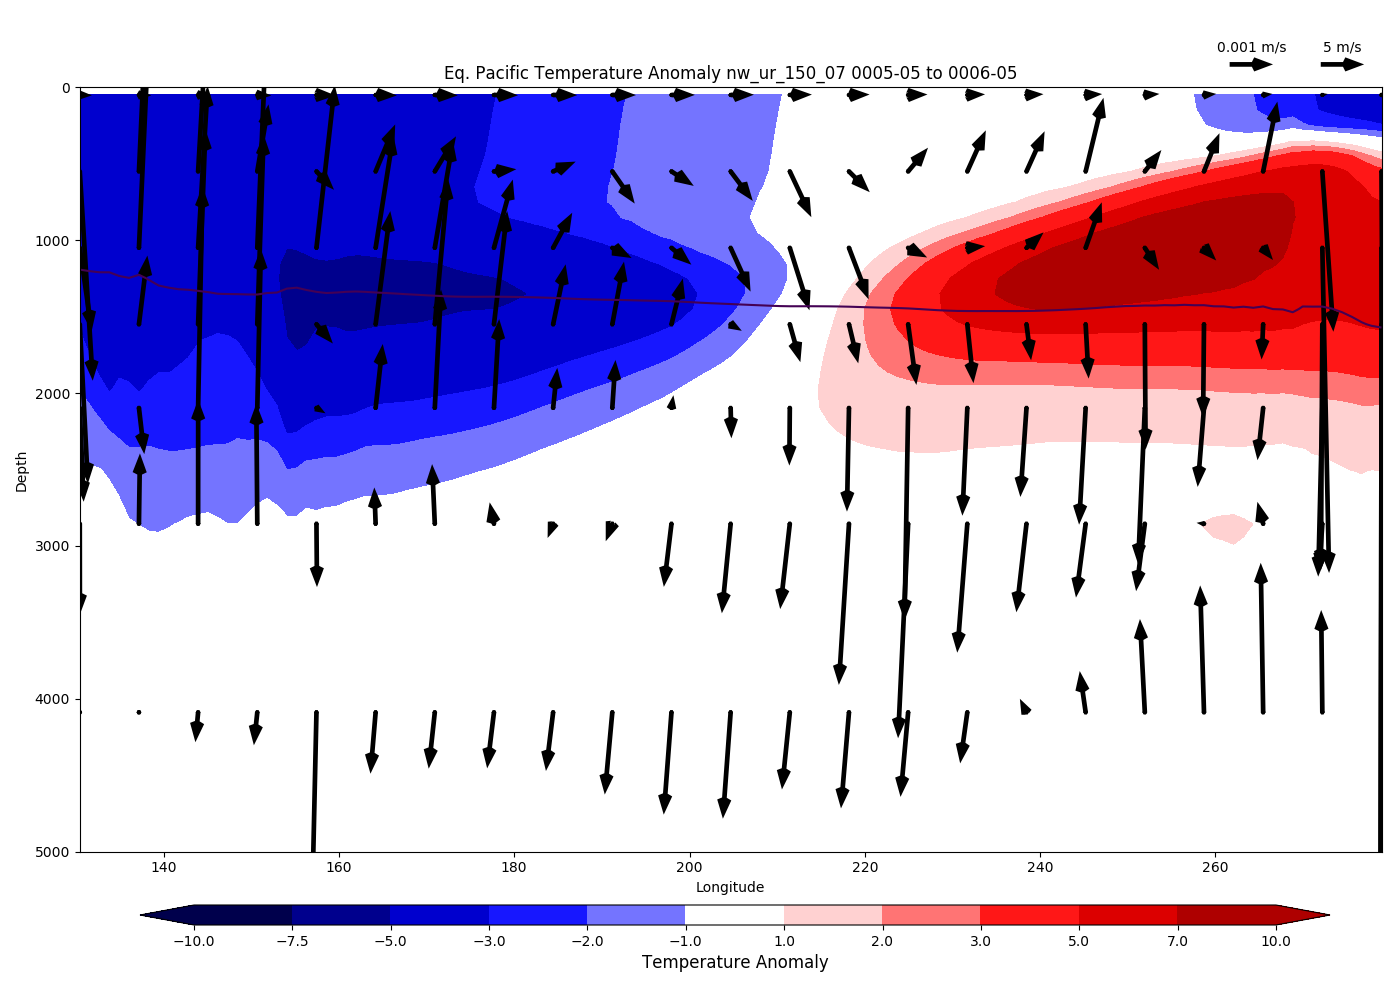
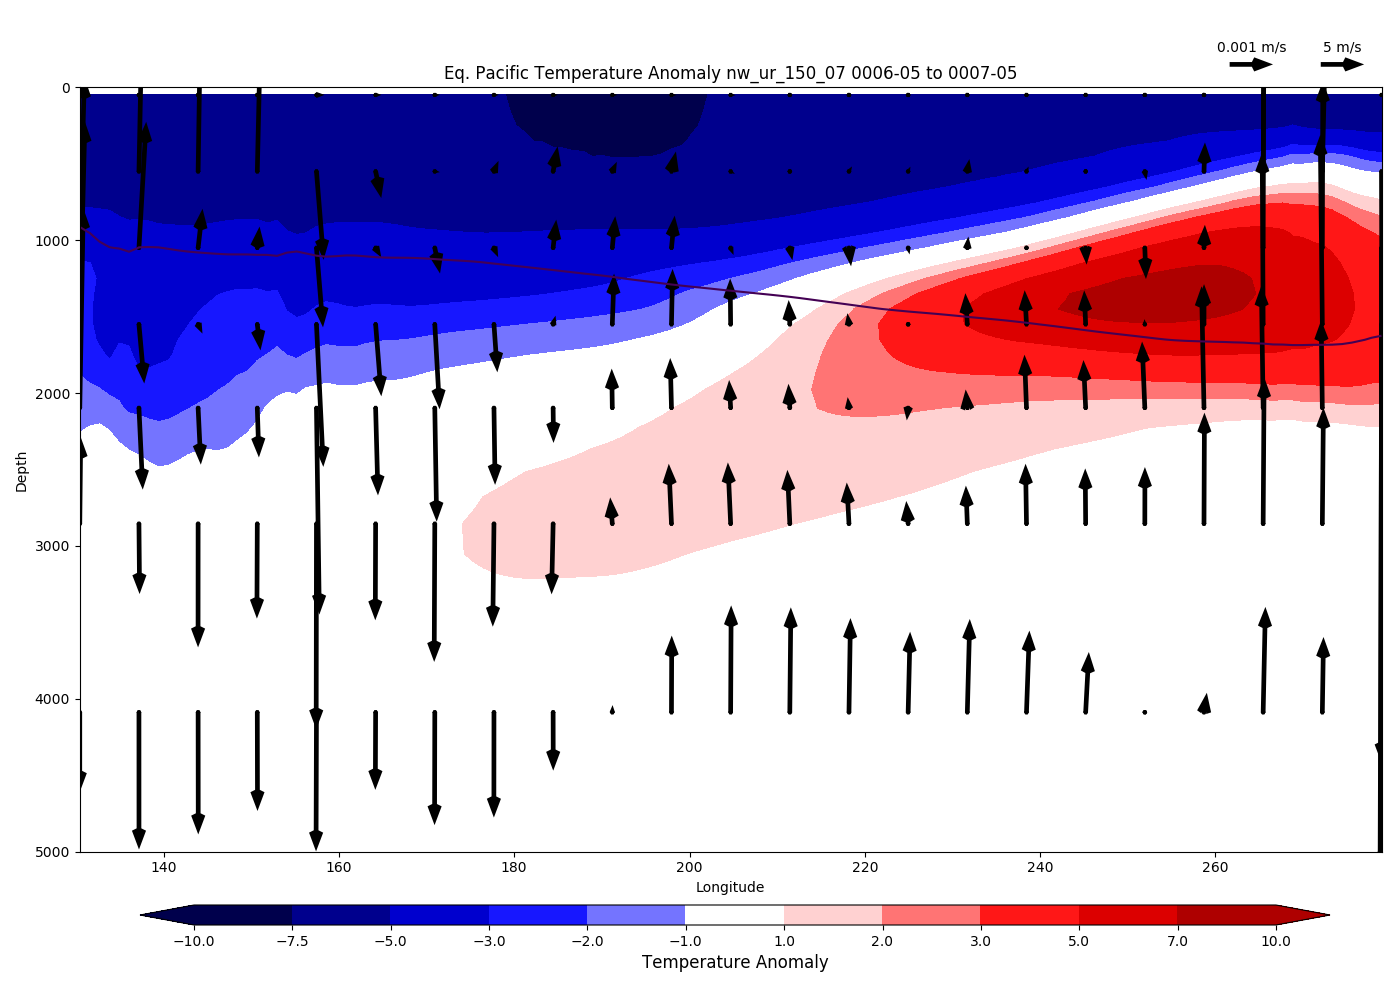
Method 1: Temperature anomalies in the ocean are calculated simply by subtracting the corresponding year/month from the control run, to account for an issue with drift in nw_cntrl_03.
Average temperature anomaly from 0005-05 to 0006-05 (left) and 0006-05 to 0007-05 (right).
|
|
|
Month by Month:
|
|
|
|
|
|
|
|
|
|
|
|
|
|
|
|
|
|
|
|
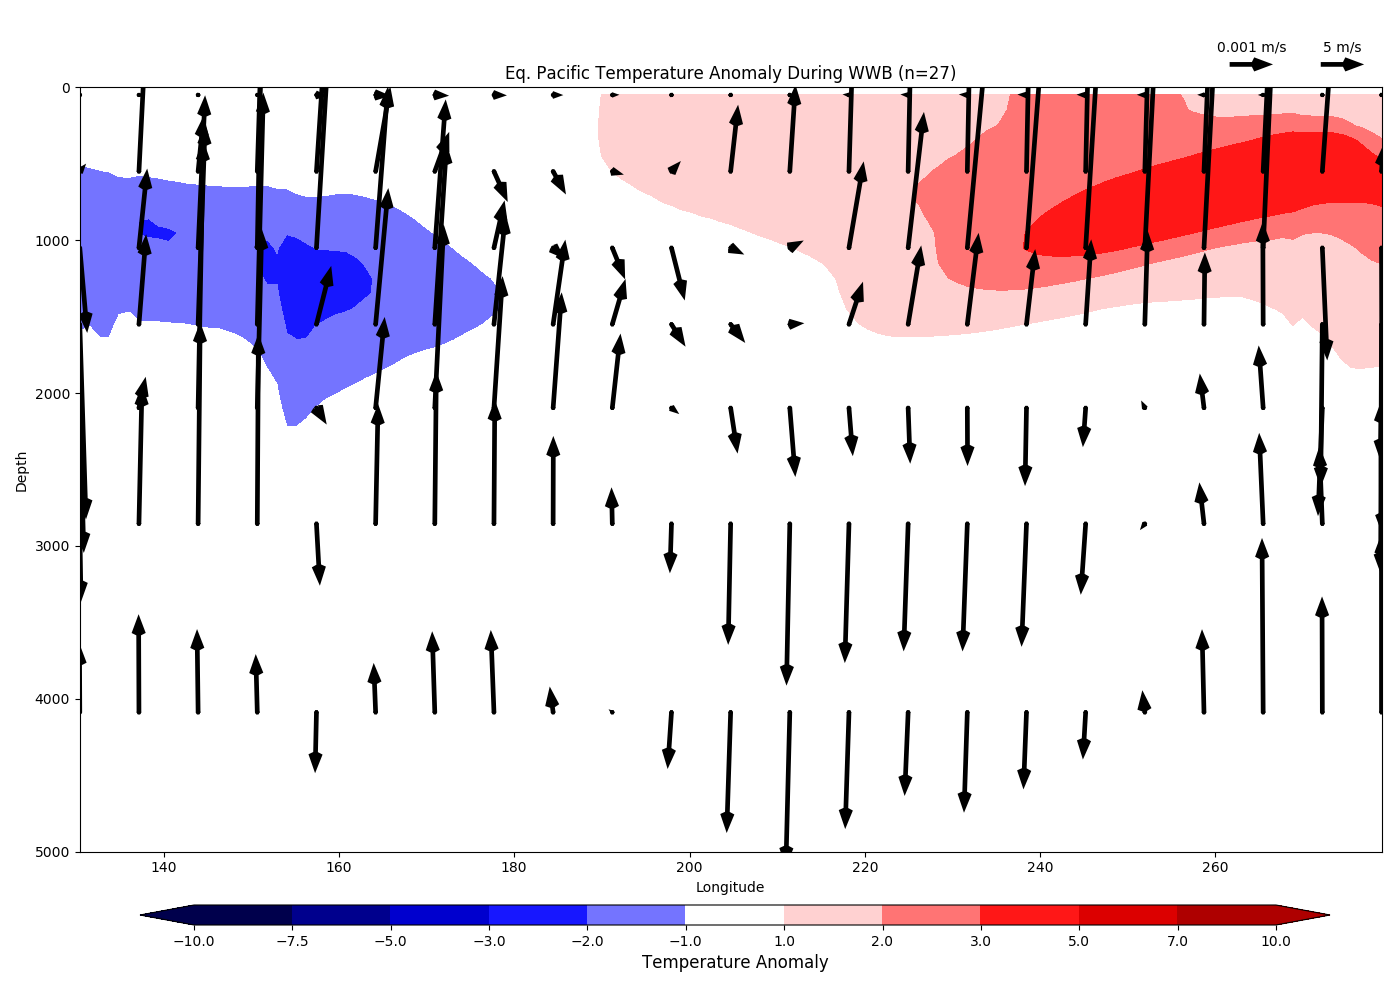
Idea: Create a composite of all months in the control run where there exists a > 5m/s westerly wind anomaly (herein referred to as Westerly Wind Bursts (WWBs)):