Objective:
Quantify mechanisms responsible for
Nuclear Nino and determine their statistical relationship with major
ENSO indices (SOI, Nino 3.4 SSTs, Nino 3.4 RSSTs, Zonal 850 hPa Wind
Anomaly, SSH).
850 hPa zonal wind anomalies are averaged between
(140°E-180°E,
5°S-5°N).
Relevant python code located here.
Outline
0.
Calculate relationship between major ENSO indices.
1. Identify
and quantify mechanisms, calculate relationship with major ENSO
indices. (- or + lags included)
2. Determine scaling with
different aerosol loads.
0. Calculate
relationship between major ENSO indices
0.1
Relationship between SOI and U850 hPa: does it change significantly
after a black carbon injection?
If there is a change in this
relationship, this may make it difficult to use these indices for
making connections with certain mechanisms.
nw_cntrl_03 (n=720 months)
|
index |
SOI |
U850 |
N34RSST |
|
SOI |
1 |
-0.51 |
-0.63 |
|
U850 |
-0.51 |
1 |
0.69 |
|
N34RSST |
-0.63 |
0.69 |
1 |
nw_ur_150_07 (n=85 months)
|
index |
SOI |
U850 |
N34RSST |
|
SOI |
1 |
-0.48 |
-0.48 |
|
U850 |
-0.48 |
1 |
0.05 |
|
N34RSST |
-0.48 |
0.05 |
1 |
Unfortunately, there is a small change in the relationship between SOI and U850 with a very large black carbon injection. The change in the Nino 3.4 relationship with zonal wind anomalies are curious.
1. Identify and
quantify mechanisms
1.1 Maritime Continent cooling / subsidence
/ high pressure
Sudden
surface cooling of the Maritime Continent leads to reduced stability,
higher pressure and subsidence, decreasing the zonal SLP gradient and
weakening the trade winds. This mechanism can be quantified by
looking at the surface temperature anomaly within the Maritime
Continent (defined here as 100°E-150°E,
10°S-10°N),
the precipitation anomaly, and the pressure anomaly over the same
area. This provides an index to measure the reduction in convection
and increased stability.
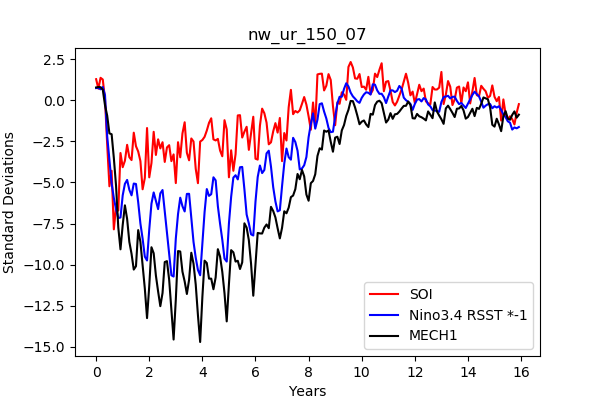
MC_mechanism = 0.5 * MCTS_anomaly + 0.25*MCPR_anomaly + 0.25*MCPS_anomaly*-1
This index should track closely with the strength of the Walker Circulation, and thus the SOI and by extension the zonal winds.
Fig. 1. Maritime Continent mechanism standardized index as compared to other relevant ENSO indices.
The Maritime Continent Mechanism Index (hereafter MECH1) has a stronger pearson correlation coefficient value with monthly SOI and 850 hPa zonal wind anomalies for the control runs. However, this relationship becomes deteriorated as more and more black carbon is injected into the stratosphere. This is evidence against using this combination of variables to quantify this mechanism, or even evidence against this mechanism playing a primary role in the development of the Nuclear Nino. The tables below show the pearson correlation coefficients for all of the cases. As total black carbon decreases, the relationship between ENSO and MECH1 eases towards the control run.
No lag is included and only the first 84 months are included in the analysis of the black carbon runs, while all of the months of the control run are included..
|
Case |
SOI |
U850 Anomaly |
Nino 3.4 RSST |
|
nw_ur_150_07 |
-0.12 |
0.28 |
|
|
nw_targets_05 |
0.45 |
-0.06 |
|
|
nw_targets_03 |
0.41 |
-0.19 |
|
|
nw_targets_02 |
0.52 |
-0.33 |
|
|
nw_targets_04 |
0.56 |
-0.41 |
|
|
nw_targets_01m01-3 |
0.66 |
-0.61 |
|
|
nw_cntrl_03 |
0.66 |
-0.71 |
|
We perform the same analysis where MECH1 leads the relevant ENSO indices by 1-month, which tells us very little.
|
Case |
SOI |
U850 Anomaly |
|
nw_ur_150_07 |
-0.22 |
0.13 |
|
nw_targets_05 |
0.32 |
-0.01 |
|
nw_targets_03 |
0.36 |
-0.08 |
|
nw_targets_02 |
0.47 |
-0.18 |
|
nw_targets_04 |
0.27 |
-0.10 |
|
nw_targets_01m01-3 |
0.53 |
-0.15 |
|
nw_cntrl_03 |
0.57 |
-0.45 |
Conclusion: MECH1 does not explain the evolution of ENSO indices following a black carbon injection. If anything, MECH1 explains it less than
1.2 ITCZ Latitude
Anomaly
The southward
shift in the Pacific Ocean ITCZ location shifts weaker trade winds
over the equator, which favors El Nino conditions (Pausata et al.,
2015; Stevenson et al., 2016). Initially, we use an index to track
the distance of the ITCZ from the equator. There are two terms in
this equation.
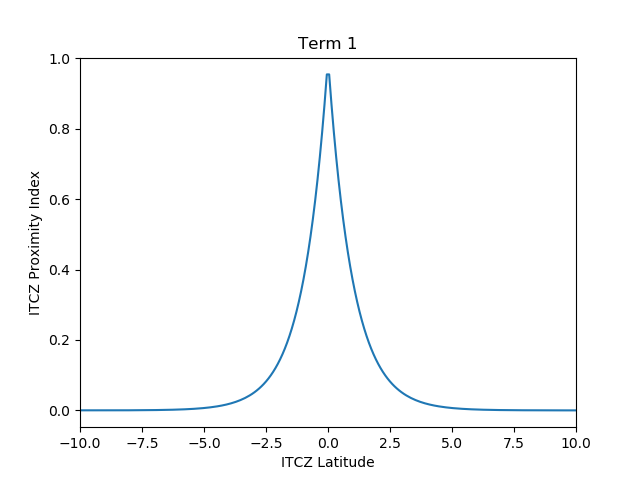
ITCZ Proximity Index = -1[ exp(-1 * |ITCZ latitude| ) * exp(-1 * |ITCZ climatological latitude|)]
Term
1 represents the effect of the location of the ITCZ. As the ITCZ
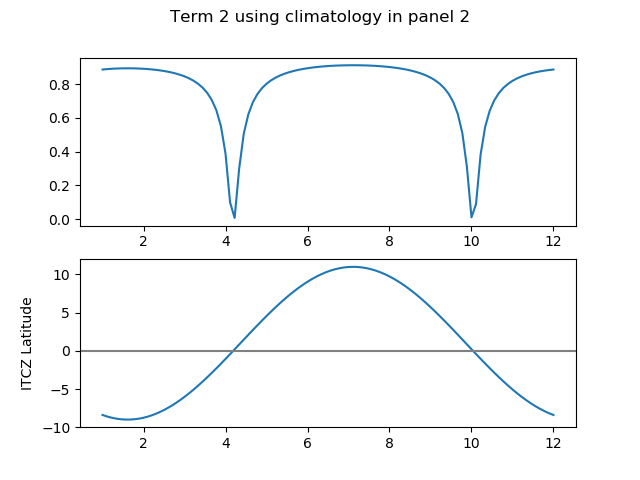
approaches the equator, term 1 asymptotes to 1. Term 2 will reduce
the value of the index if the climatological position of the ITCZ is
normally near the equator. Because this index is intended to capture
the ITCZ proximity with respect to climatology, this term will help
filter out these months and remove the seasonal cycle from the index.
However, there is a seasonal cycle often observed with ENSO. I will
conduct an analysis to determine if this term is necessary.
Fig.
2 (a) shows term 1 of the
proximity index with latitude and (b) shows term 2 under the assumed
climatology.
|
|
|
To demonstrate the effectiveness of each term in contributing to El Nino conditions in CESM-WACCM4, we will show how they can predict El Nino conditions and we will compare the performance of the terms. Fig. 3 shows term one of the proximity index along with the SOI for the first 84 months of the 150 Tg US-Russia case.
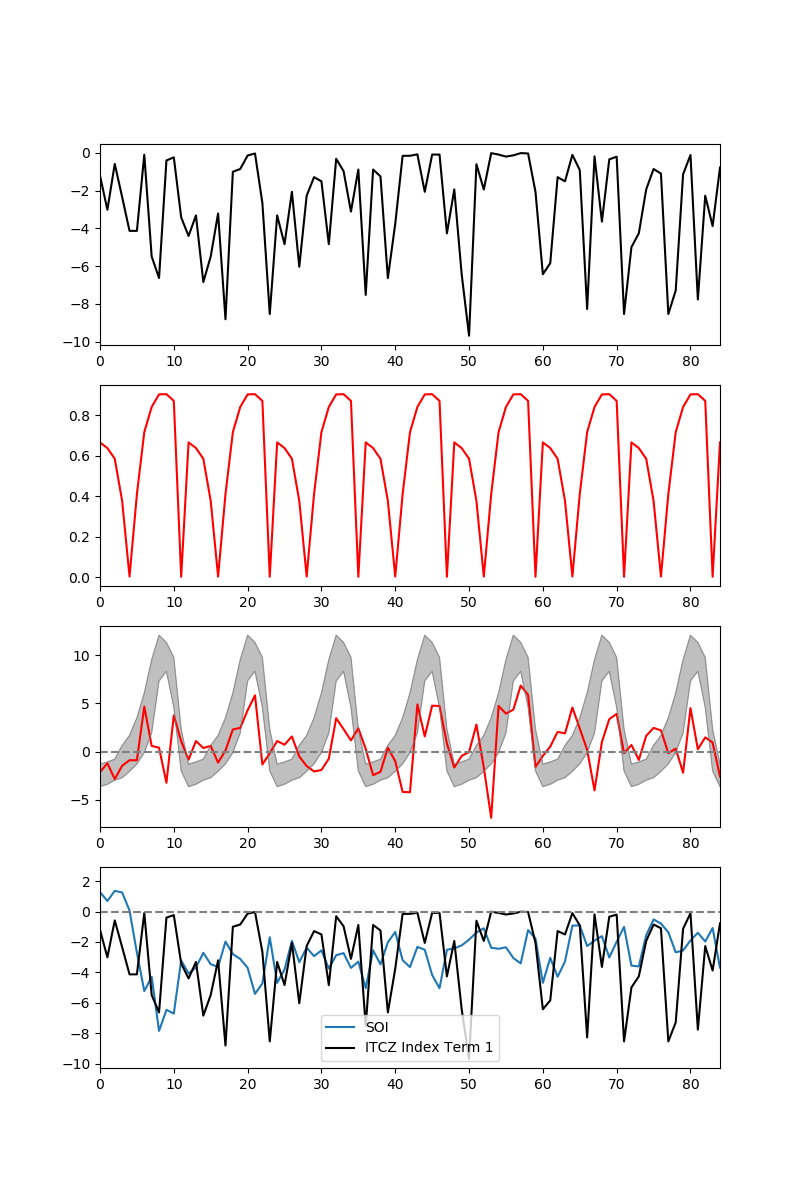
There
is a clear improvement in performance of the index when the
climatology term (term 2) is included (r=0.01 vs r=0.195 when
compared to SOI). Performance is not very good for the nw_ur_150_07
case, unfortunately.
Control run: r =
-0.03, p=0.41
nw_ur_150_07: r=0.19, p=0.08
nw_targets_05:
r=-0.011, p=0.92
nw_targets_03: r=0.217, p=0.045
nw_targets_02:
r=0.18, p=0.09
nw_targets_04: r=0.047, p=0.67
nw_targets_01x:
r=0.24, p=0.026
In conclusion, the ITCZ proximity index does not
explain changes in the SOI very well in CESM-WACCM4 with and without
black carbon injections.
For the next approach, we test to see if there is any link to equatorial wind anomalies and ITCZ proximity at all.
1.3 Subtropical High Pressure Anomaly in North Pacific Ocean
North Pacific subtropical high pressure is weakened by the weakened Hadley Circulation. What is typically an area of subsidence over the subtropical North Pacific Ocean sees much lower pressures and causes an anomalous low pressure circulation over the area. In the southern part of the North Pacific Ocean, near the equator, this results in zonal winds that are more westerly.
Correlation between SOI and MSLP anomaly averaged over lon1=150,lon2=270,lat1=10,lat2=45.
0 Tg Control Ens 1 0.3358195038742622 1.937169372898621e-20
150 Tg US-Russia 0.5496531408504615 1.4999635000585205e-16
46.8 Tg India-Pakistan 0.5217263797220257 5.910223243417906e-14
37 Tg India-Pakistan 0.5018480391564414 7.137874642005594e-13
27.3 Tg India-Pakistan 0.15546054557508565 0.04419827804656742
16 Tg India-Pakistan 0.31645446050542897 1.5056934509314366e-05
5 Tg India-Pakistan Ens Avg 0.381375540251103 1.2774472088162662e-07
Correlation between U850 anomaly and MSLP anomaly averaged over lon1=150,lon2=270,lat1=10,lat2=45.
0 Tg Control Ens 1 -0.528484813248408 4.828889258159237e-53
150 Tg US-Russia -0.4822680854283936 1.411055407377381e-12
46.8 Tg India-Pakistan -0.4705761962523397 2.6319684260413544e-11
37 Tg India-Pakistan -0.47723265846944396 1.258816759371971e-11
27.3 Tg India-Pakistan -0.026807373495704608 0.7301461757436001
16 Tg India-Pakistan -0.34942019354224185 1.5265995596327634e-06
5 Tg India-Pakistan Ens Avg -0.5037891410779594 5.636101723294655e-13
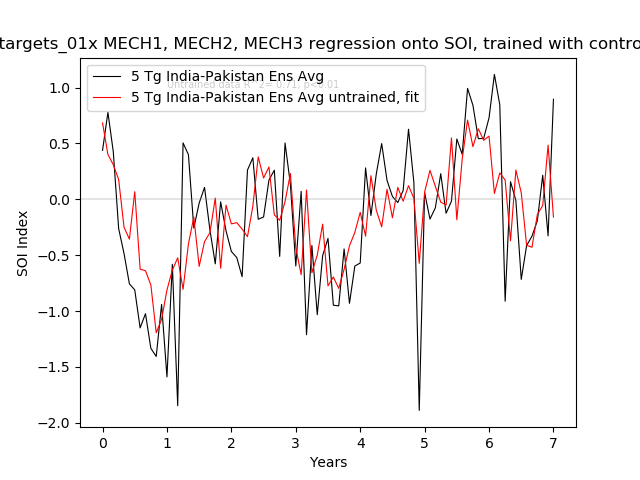
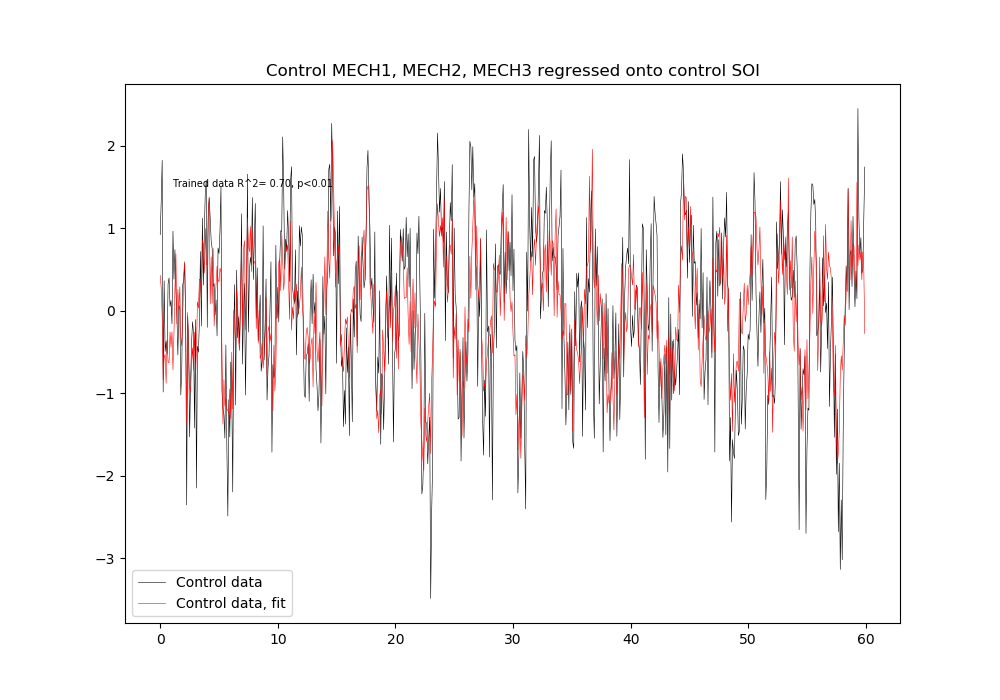
2. Multiple Linear Regression of all Variables
Control MECH1, MECH2, MECH3 regressed onto the SOI for the control run: (R2 = 0.61, p<0.01)
Relationship of MECH1, MECH2, MECH 3 regression onto SOI for all cases
|
Case |
r_value |
r_value (3-mo mean) |
Number of months |
|
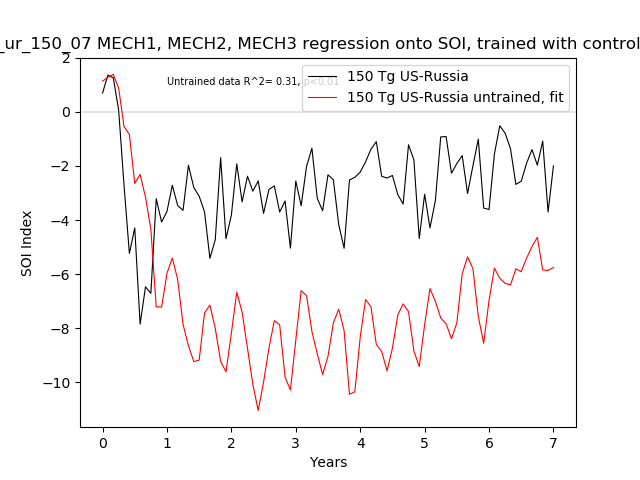
nw_ur_150_07 |
0.32 |
0.32 |
85 / 83 |
|
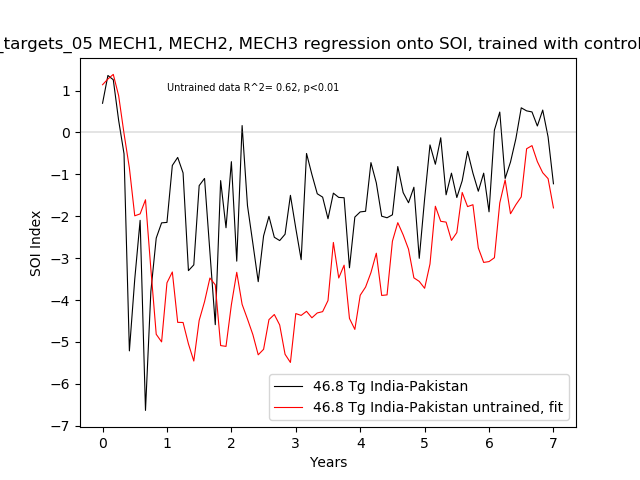
nw_targets_05 |
0.65 |
0.70 |
85 / 83 |
|
nw_targets_03 |
0.63 |
0.67 |
85 / 83 |
|
nw_targets_02 |
0.61 |
0.69 |
85 / 83 |
|
nw_targets_04 |
0.67 |
0.74 |
85 / 83 |
|
nw_targets_01x |
0.73 |
0.86 |
85 / 83 |
|
nw_cntrl03m01-m03 |
0.70 |
0.80 |
720 / 83 |
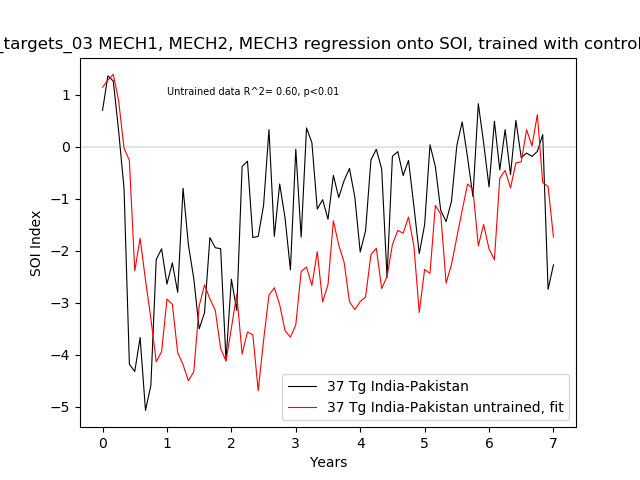
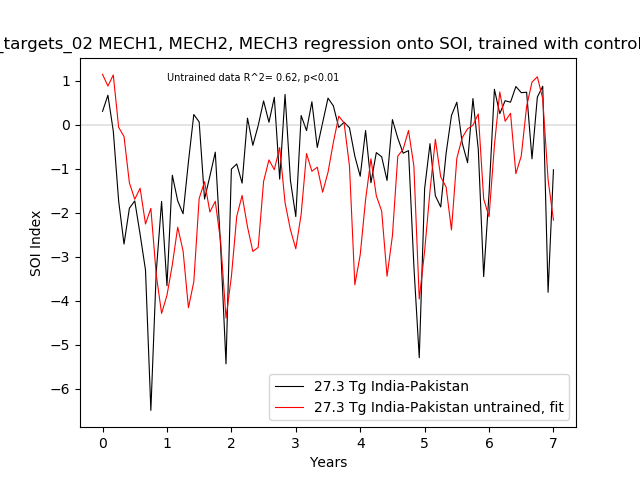
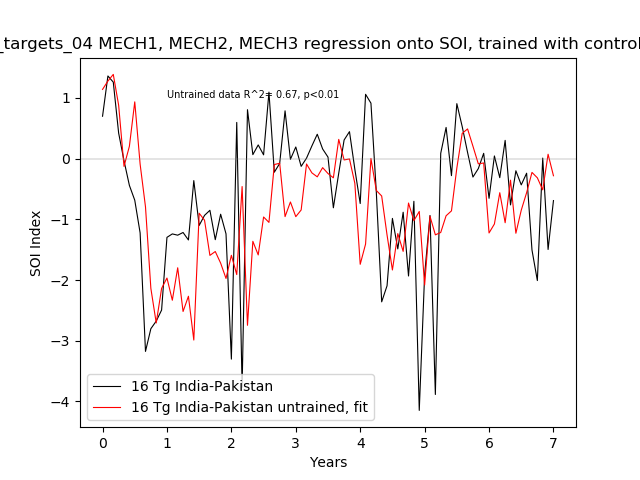
What’s interesting is the deviation from the control value (r=0.60) in the 5 Tg nw_targets_01x cases compared to the 150 Tg nw_ur_150_07 case.
The low correlation cases are because the regression model can not replicate the very low SOI values. They are simply not trained with extreme enough data.
This could be interpreted as a fundamental change in the way these mechanisms contribute to El Nino as the black carbon loading increases.
nw_ur_150_07 MECH1, MECH2, and MECH3 (n=85) regressed onto SOI. Trained with control data, compared with actual SOI. Shows that based on the relationships during the control run (n=720 month), the evolution of the three mechanisms predict a much stronger shift in the SOI that favors an even stronger El Nino response.
nw_targets_05 MECH1, MECH2, and MECH3 (n=85) regressed onto SOI. Trained with control data, compared with actual SOI. Shows that based on the relationships during the control run (n=720 month), the evolution of the three mechanisms predict a much stronger shift in the SOI that favors an even stronger El Nino response.
nw_targets_03 MECH1, MECH2, and MECH3 (n=85) regressed onto SOI. Trained with control data, compared with actual SOI. Shows that based on the relationships during the control run (n=720 month), the evolution of the three mechanisms predict a much stronger shift in the SOI that favors an even stronger El Nino response.
nw_targets_02 MECH1, MECH2, and MECH3 (n=85) regressed onto SOI. Trained with control data, compared with actual SOI. Shows that based on the relationships during the control run (n=720 month), the evolution of the three mechanisms predict a much stronger shift in the SOI that favors an even stronger El Nino response.
nw_targets_04 MECH1, MECH2, and MECH3 (n=85) regressed onto SOI. Trained with control data, compared with actual SOI. Shows that based on the relationships during the control run (n=720 month), the evolution of the three mechanisms predict a much stronger shift in the SOI that favors an even stronger El Nino response.
nw_targets_01 MECH1, MECH2, and MECH3 (n=85) regressed onto SOI. Trained with control data, compared with actual SOI. Shows that based on the relationships during the control run (n=720 month), the evolution of the three mechanisms predict a much stronger shift in the SOI that favors an even stronger El Nino response.