Removing ENSO Signal from Nuclear Winter Anomalies
To quantify the effect of the Nuclear Nino amidst a highly perturbed climate following the injection of black carbon into the stratosphere, we conduct a simple linear regression of SOI during the control run onto a number of variables. Then, we use the evolution of the SOI during the 150 Tg black carbon case to determine the signal attributable to El Nino conditions.
Temperature
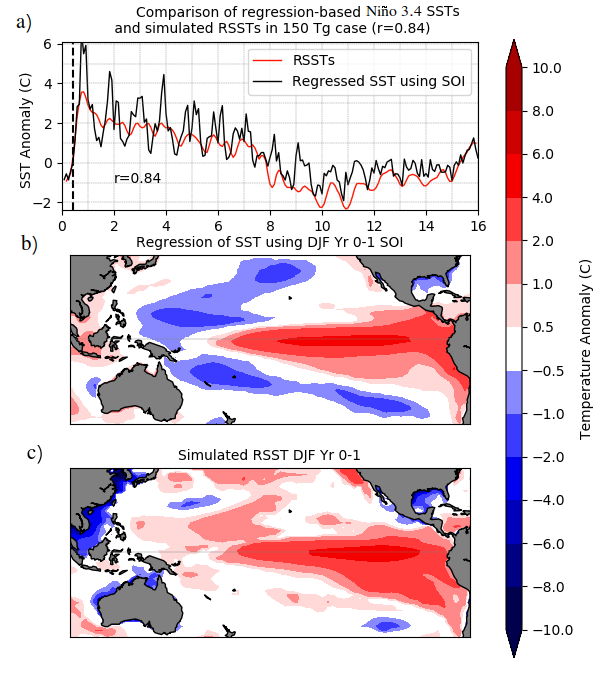
The plot below shows (a) a comparison of the simulated Nino 3.4 RSSTs in the 150 Tg US-Russia nuclear war scenario (red line) and the regressed Nino 3.4 SSTs using the monthly SOI index. SSTs are compared to RSSTs because global cooling in the nuclear war simulation must be accounted for. There is a very strong relationship between the regressed (or expected) SSTs and the simulated SSTs.
(b) Shows a regression of SSTs based on the SOI during DJF Yr 0-1 of the 150 Tg US-Russia nuclear war simulation.
(c) Shows the RSSTs during DJF Yr 0-1 of the 150 Tg US-Russia nuclear war simulation.
Noteworthy are the remarkable similarities in spatial patterns of regressed (or expected) SSTs and the simulated RSSTs after the injection of black carbon.
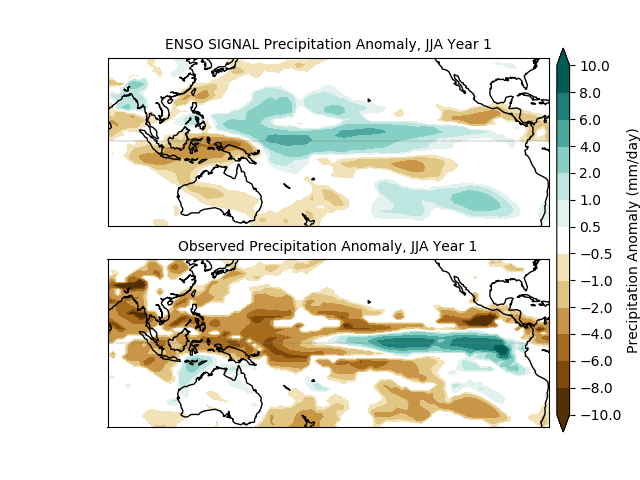
Precipitation
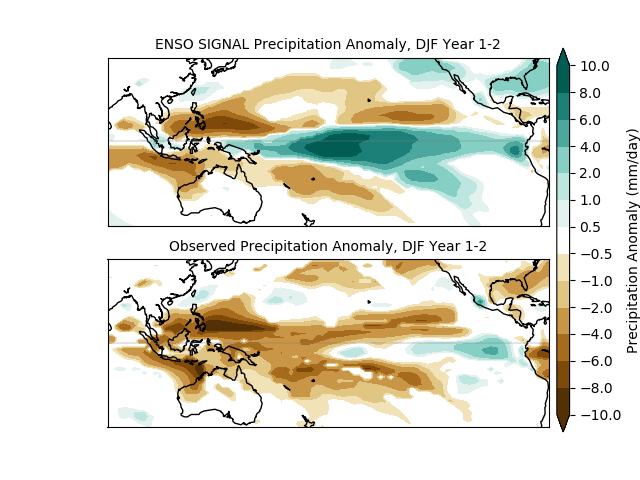
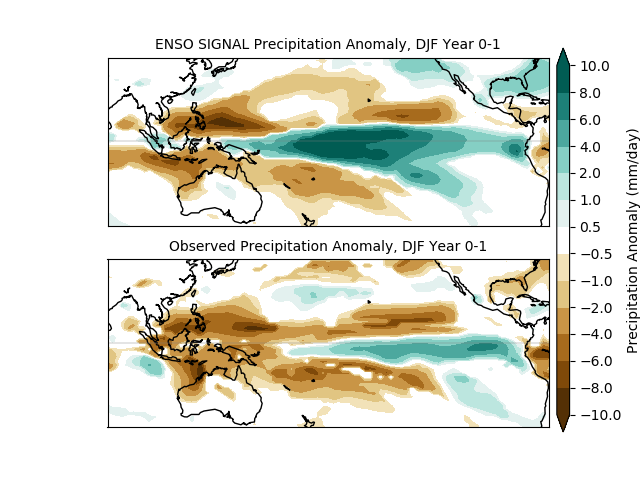
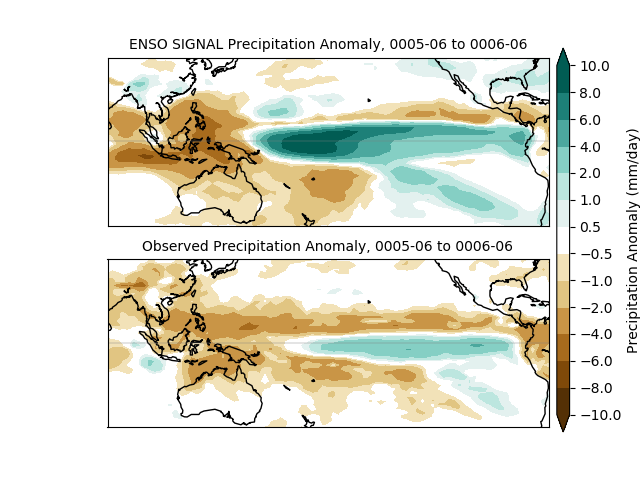
We perform a similar analysis for precipitation and find comparable signals in reduced precipitation over the Maritime Continent.
DJF Year 0-1:
First year:
JJA Year 1:
DJF Year 1-2: