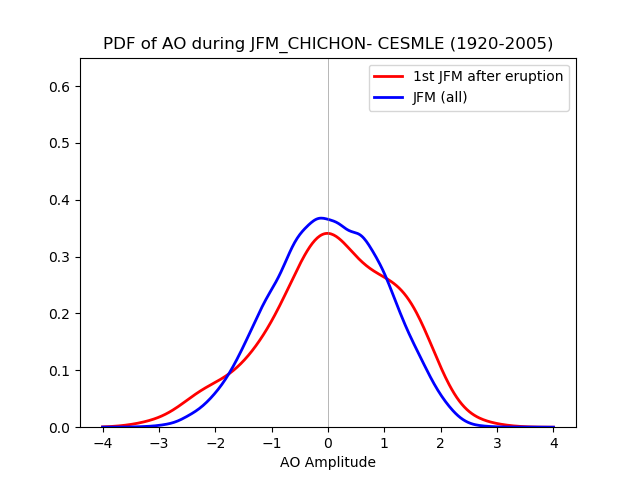
PDF
of AO during JFM 1964 - CESM-LE
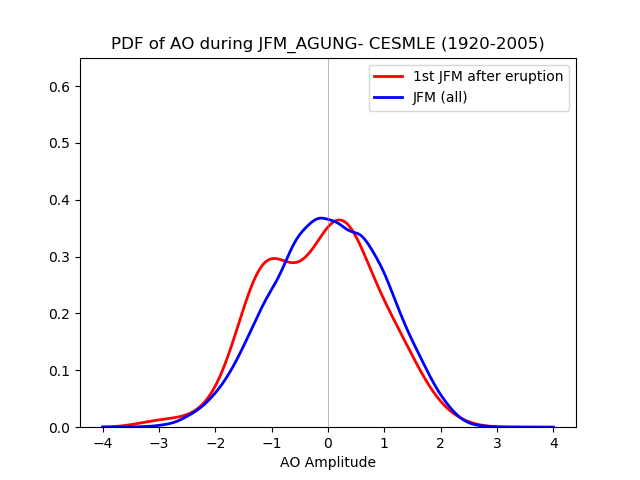
PDF
of AO during JFM 1983 - CESM-LE
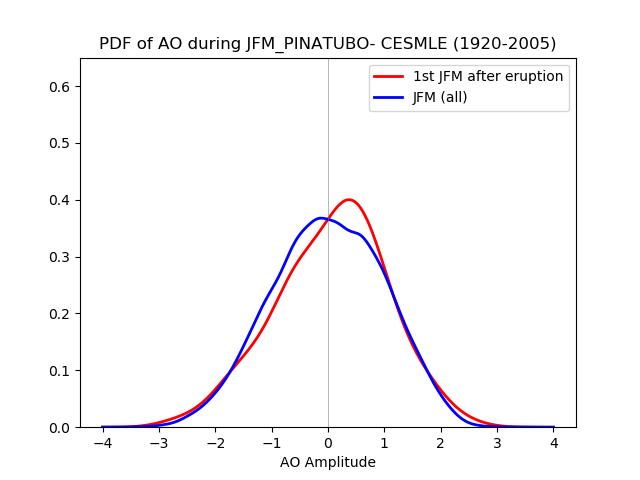
PDF
of AO during JFM 1992 - CESM-LE
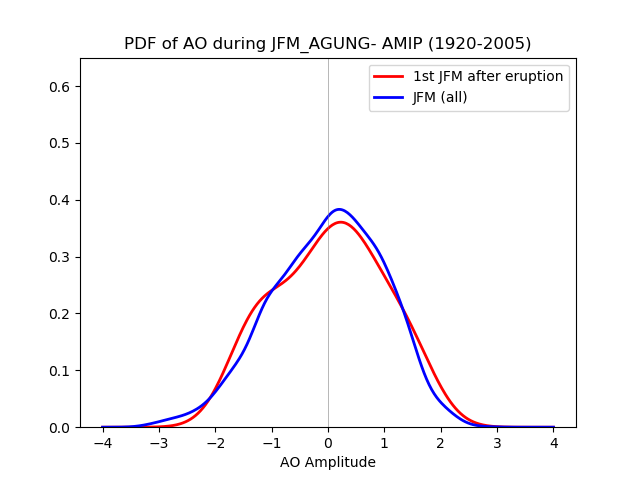
PDF
of AO during JFM 1964 - AMIP-TOGA
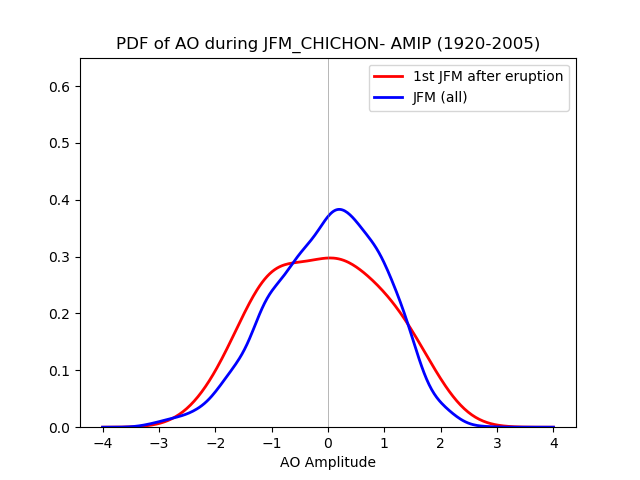
PDF
of AO during JFM 1983 – AMIP-TOGA
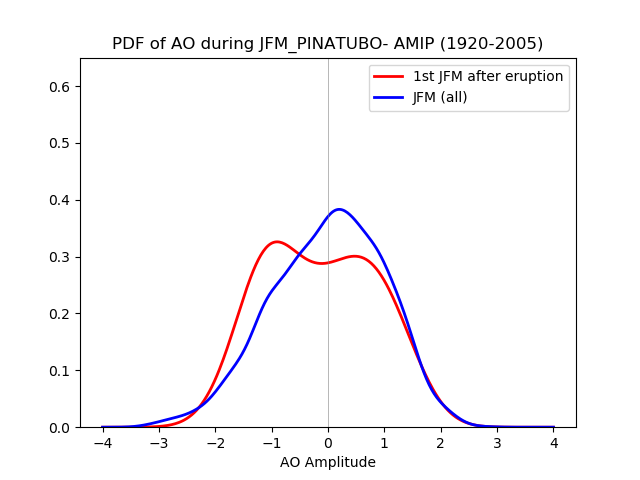
PDF
of AO during JFM 1992 – AMIP-TOGA
CESM-LE vs AMIP-TOGA
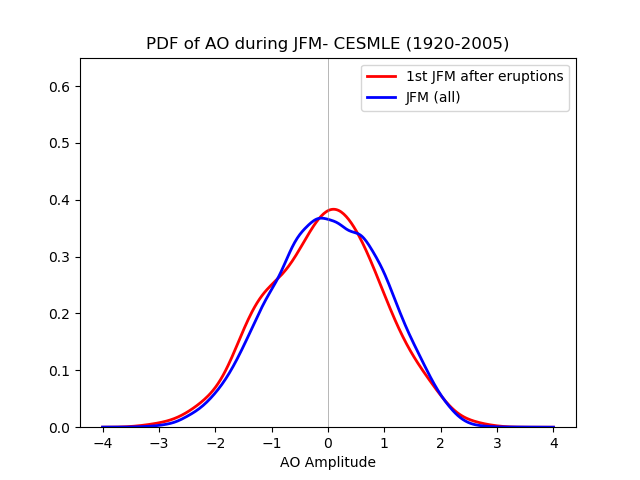
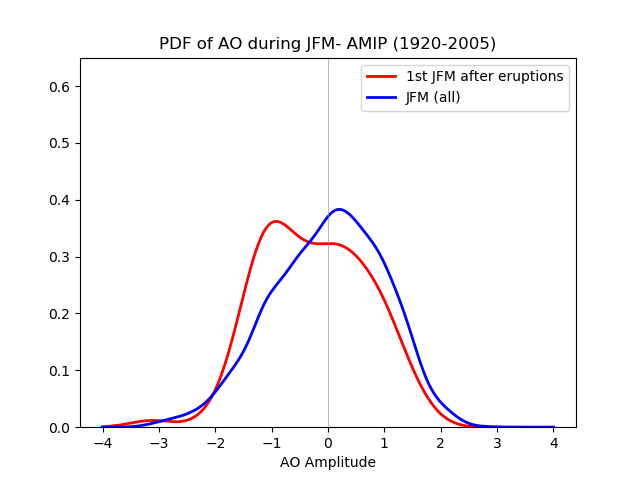
We compare the PDF of AO during JFM in 42 ensembles of CESM-LE compared to 10 ensembles of AMIP-TOGA during JFM for three 20th century volcanic eruptions. The average response for the three eruptions is in Figure 1. The average observed AO/NAO during the JFM after each eruption is as follows:
1964 JFM:
AO=-0.249 NAO=-1.19
1983 JFM: AO=-0.338 NAO= 0.67
1992 JFM:
AO=0.885 NAO = 0.54
AVERAGE: AO = 0.01 NAO= 0.00
Fig. 1: PDF of AO during JFM in CESM-LE (average of 42 ensembles) vs PDF of AO during JFM in AMIP-TOGA (average of 10 ensembles) for all 20th century volcanic eruptions.
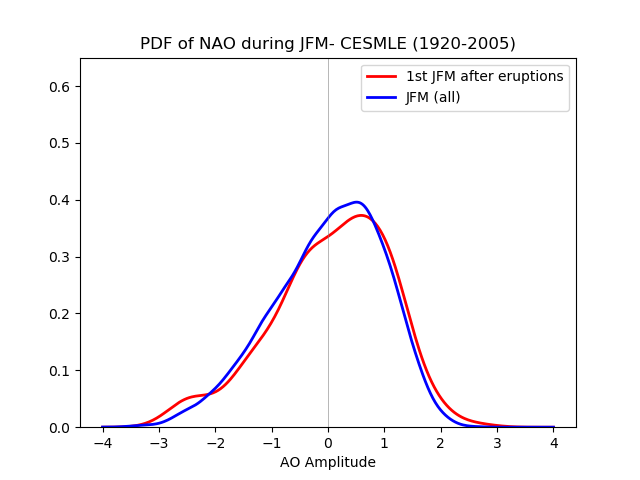
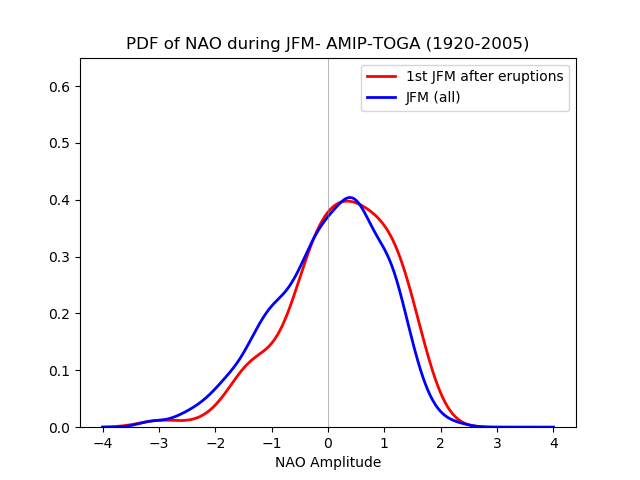
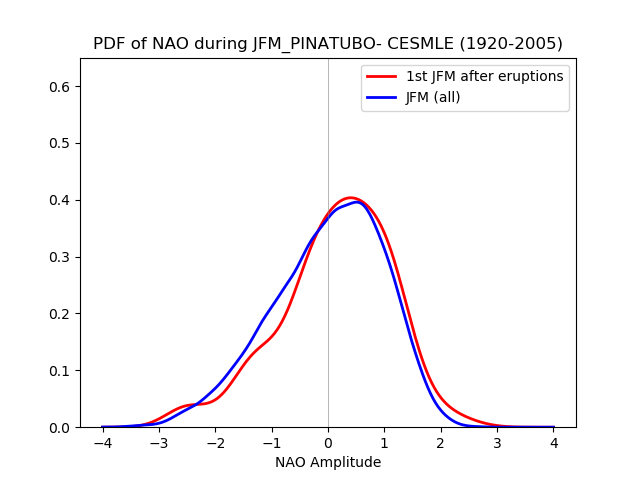
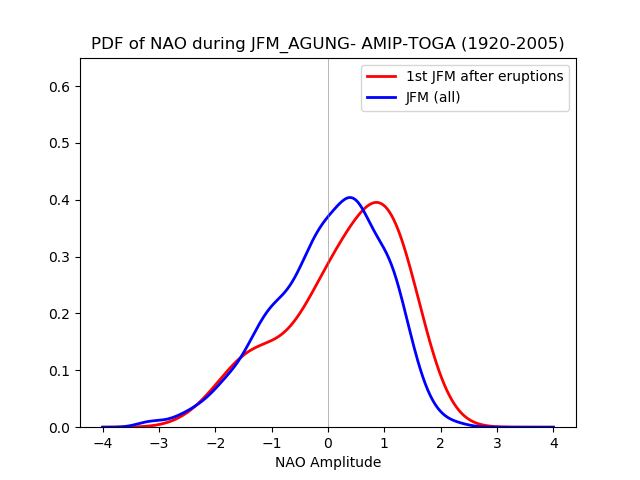
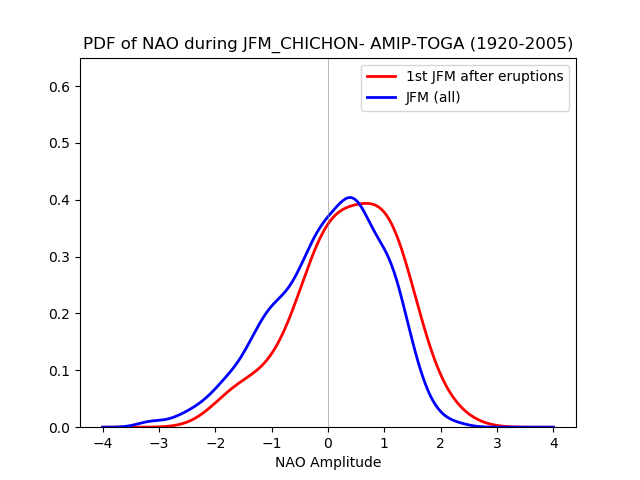
Fig. 2: PDF of NAO during JFM in CESM-LE (average of 42 ensembles) vs PDF of NAO during JFM in AMIP-TOGA (average of 10 ensembles for all 20th century volcanic eruptions.
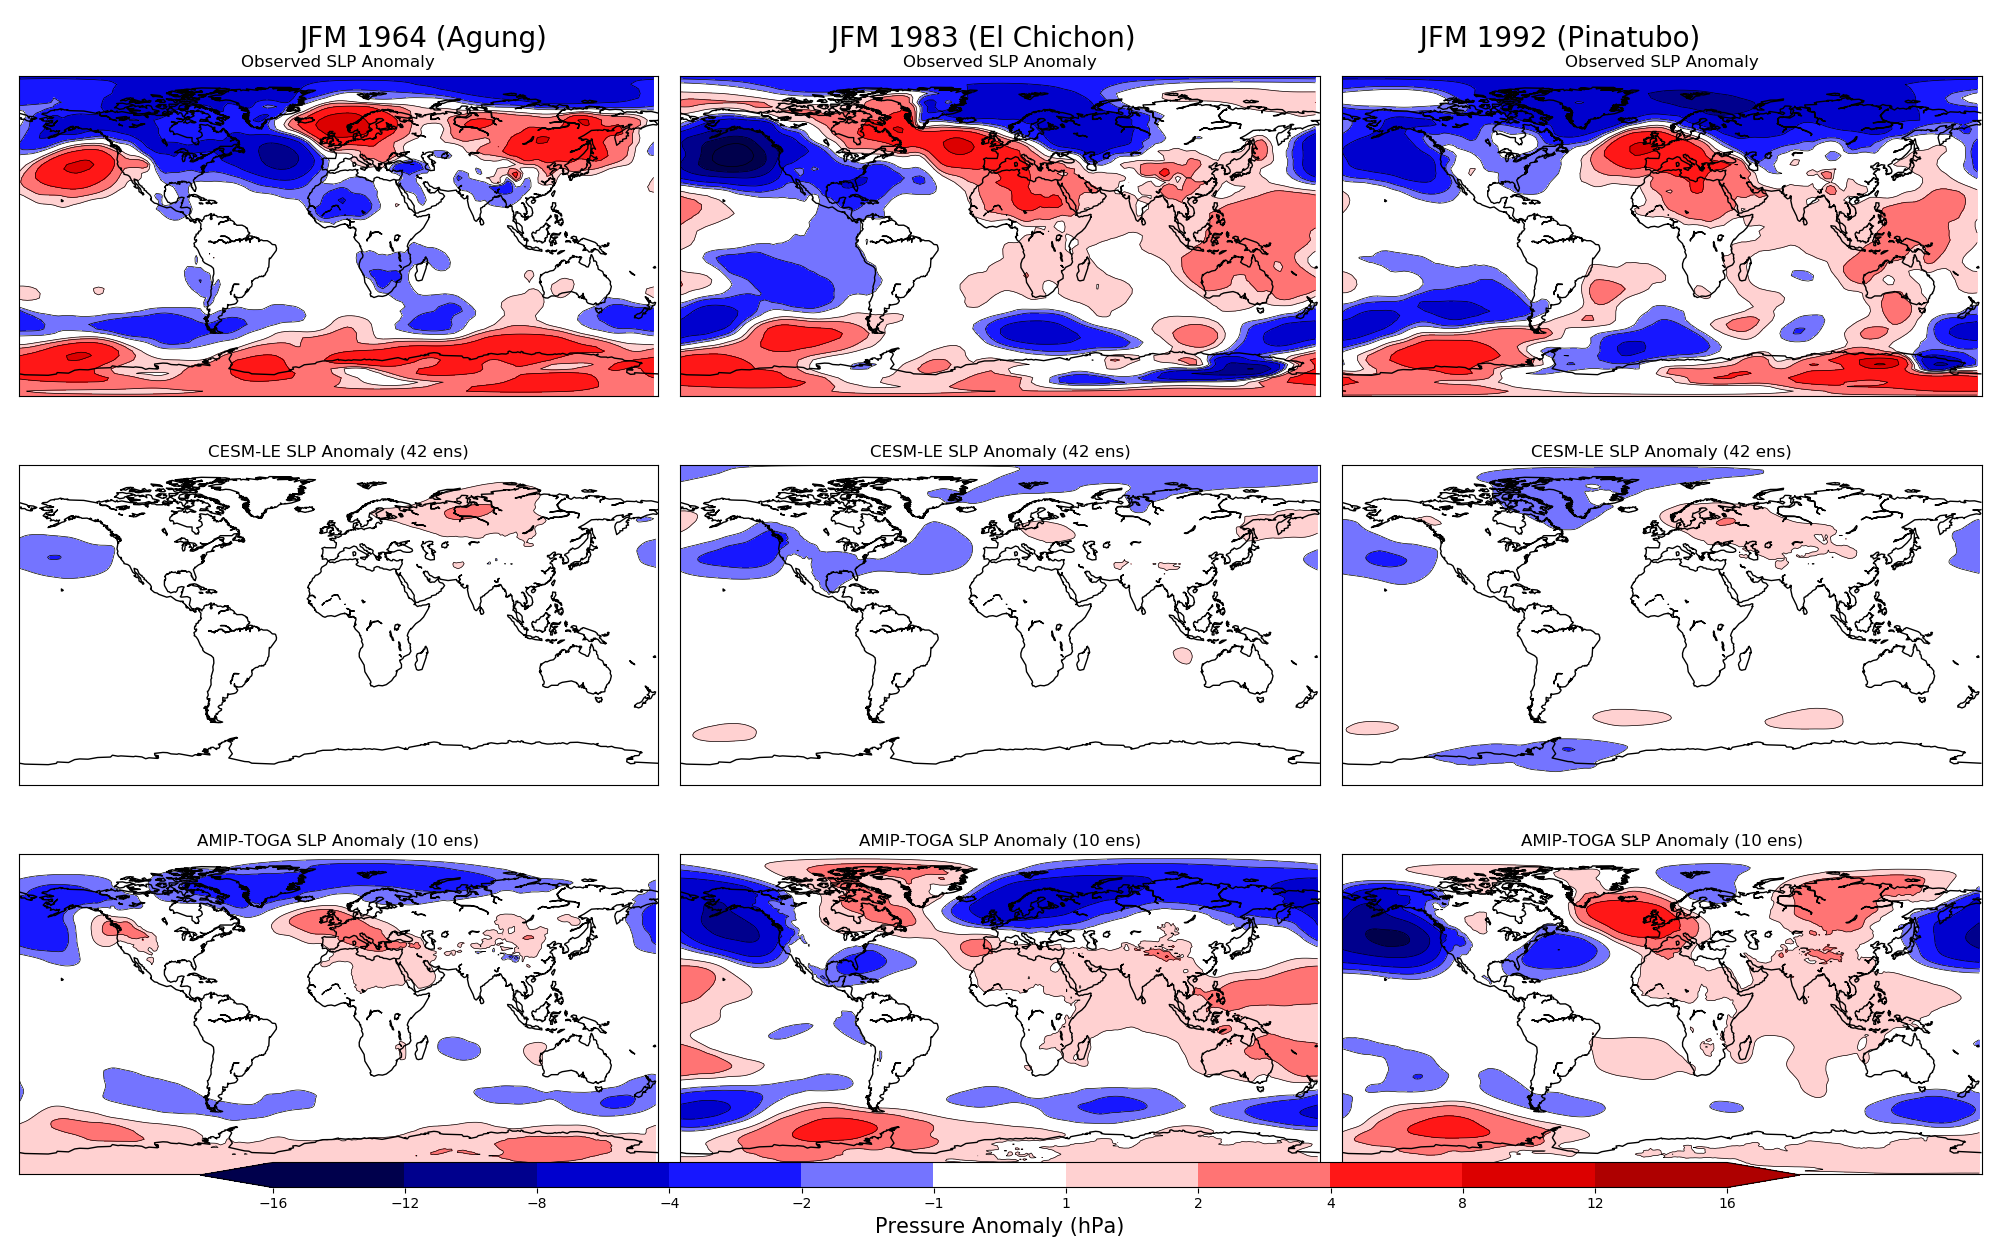
Fig. 3: SLP anomaly in CESM-LE for the first JFM after the (a) Agung eruption, (b) El Chichon eruption, and (c) Pinatubo eruption in observations, CESM-LE, and AMIP-TOGA.
|
|
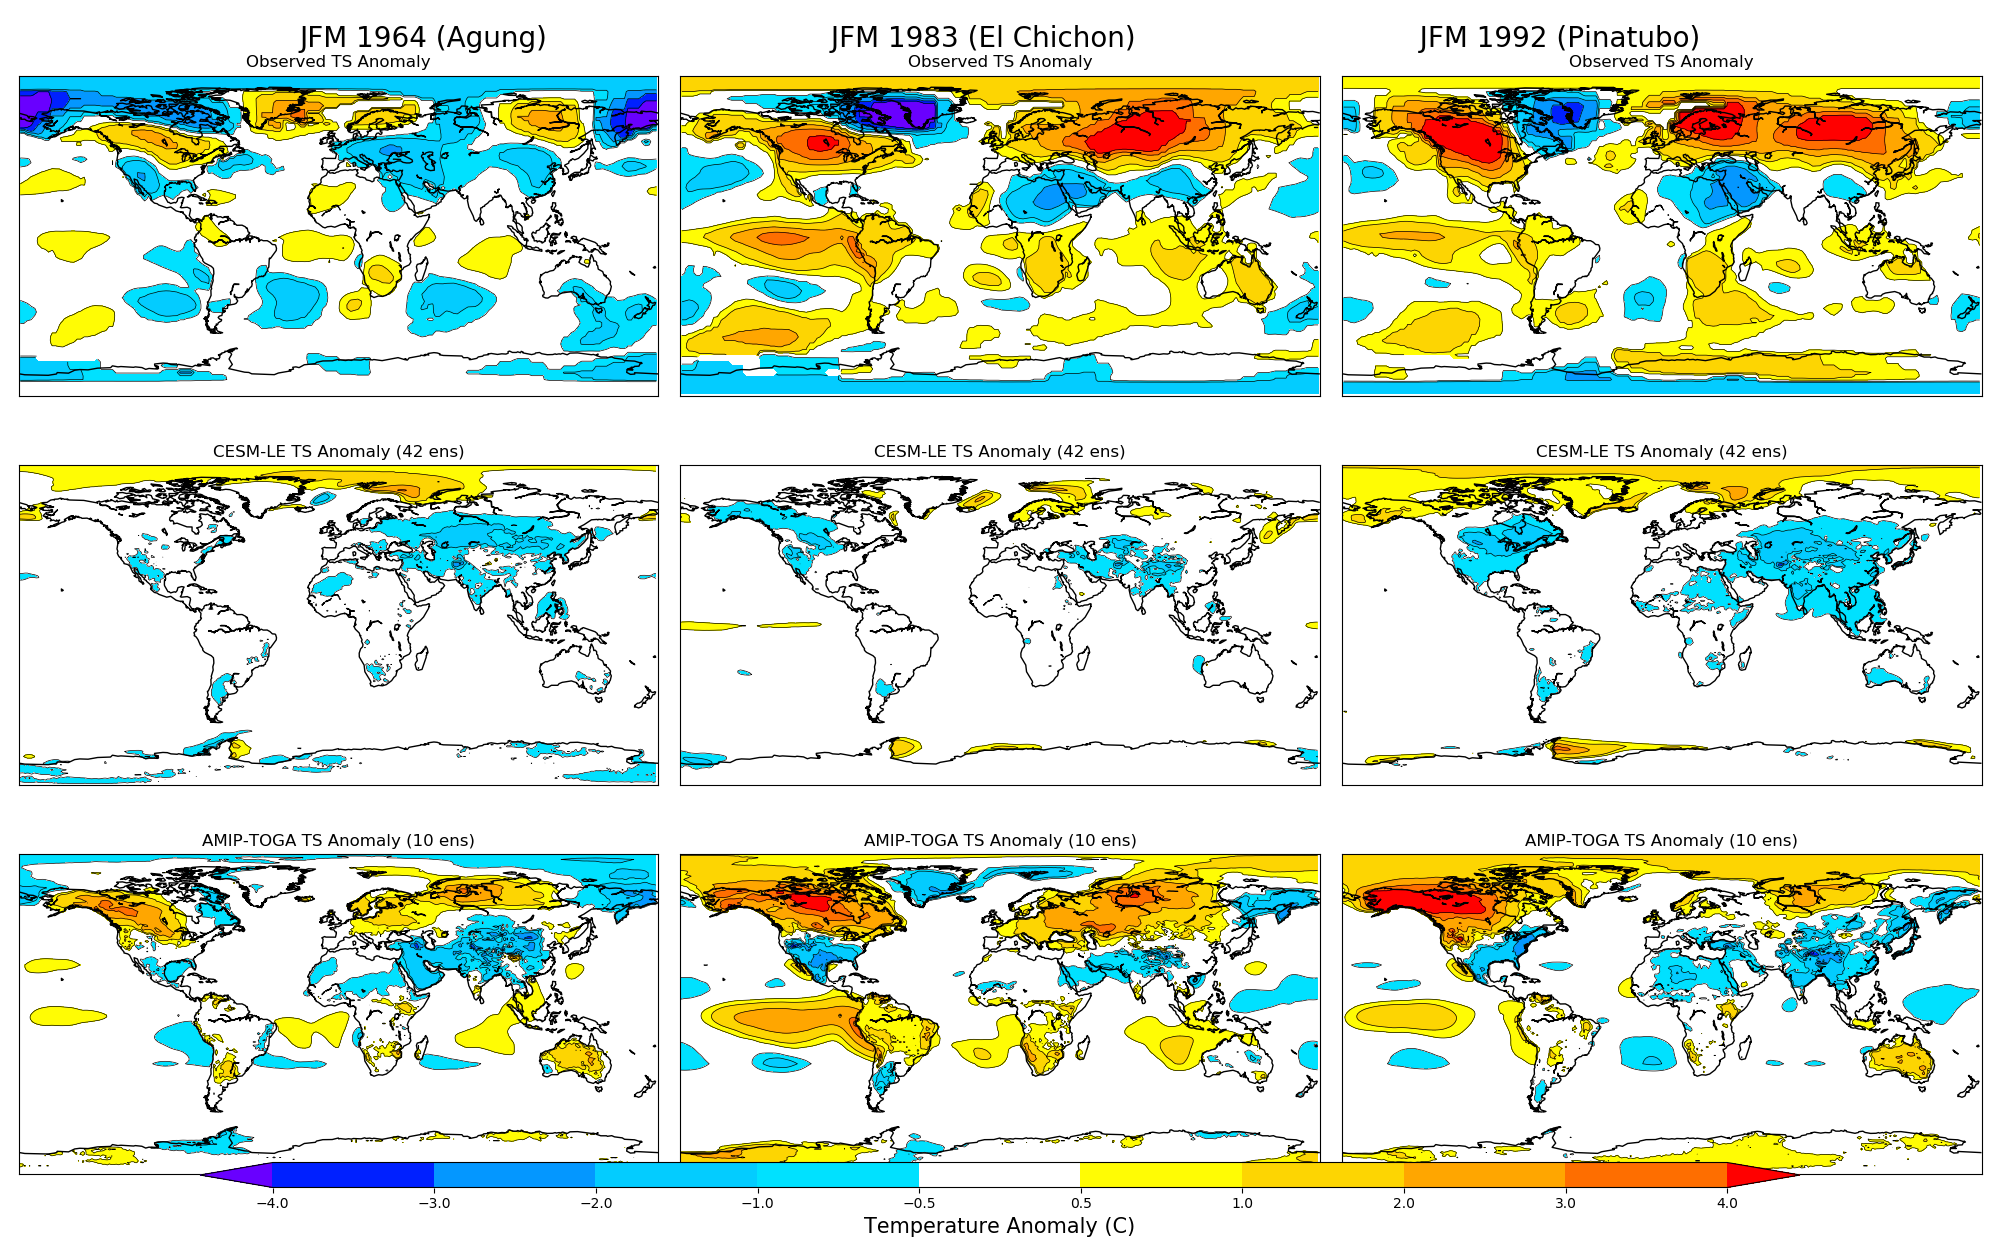
Fig. 4. Surface temperature anomaly for the first JFM after the (a) Agung eruption, (b) El Chichon eruption, and (c) Pinatubo eruption in observations, CESM-LE, and AMIP-TOGA.
|
|
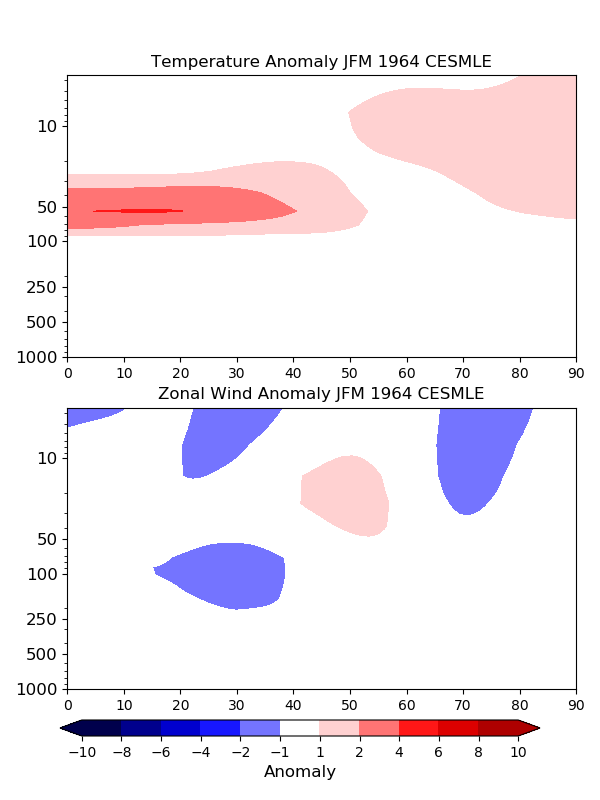
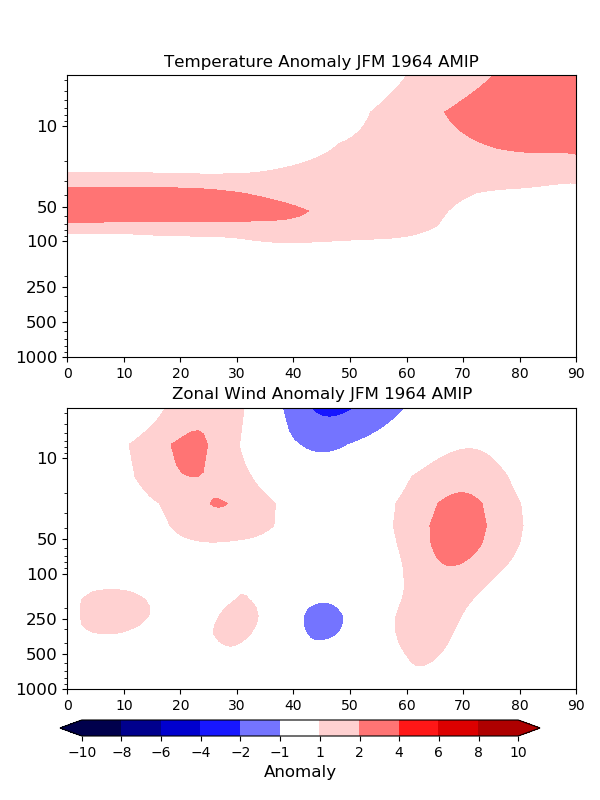
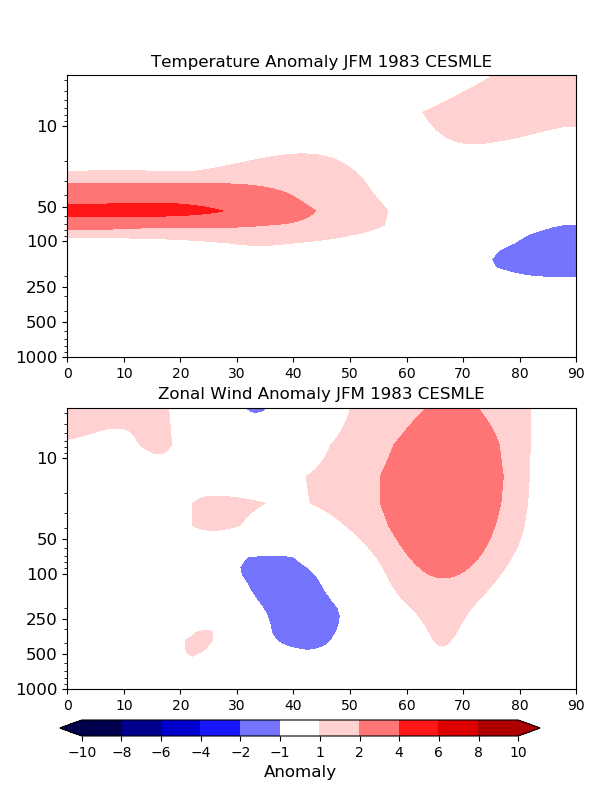
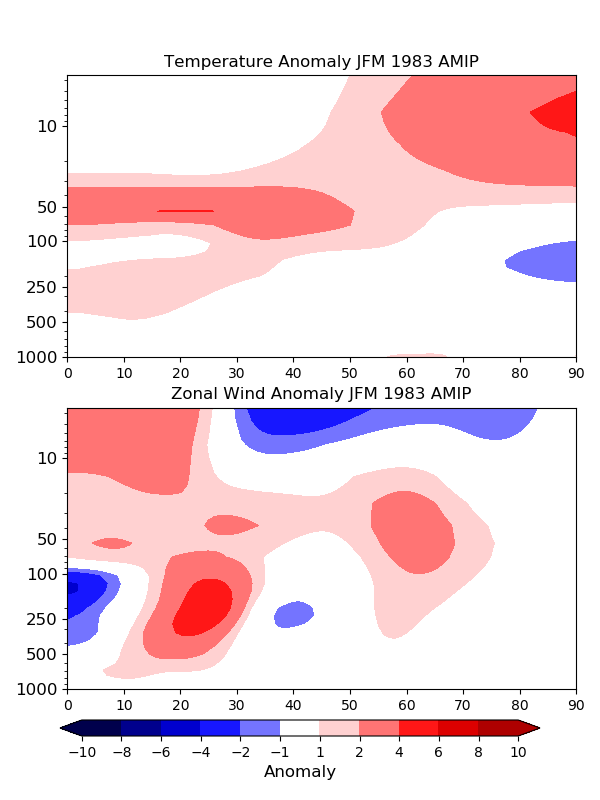
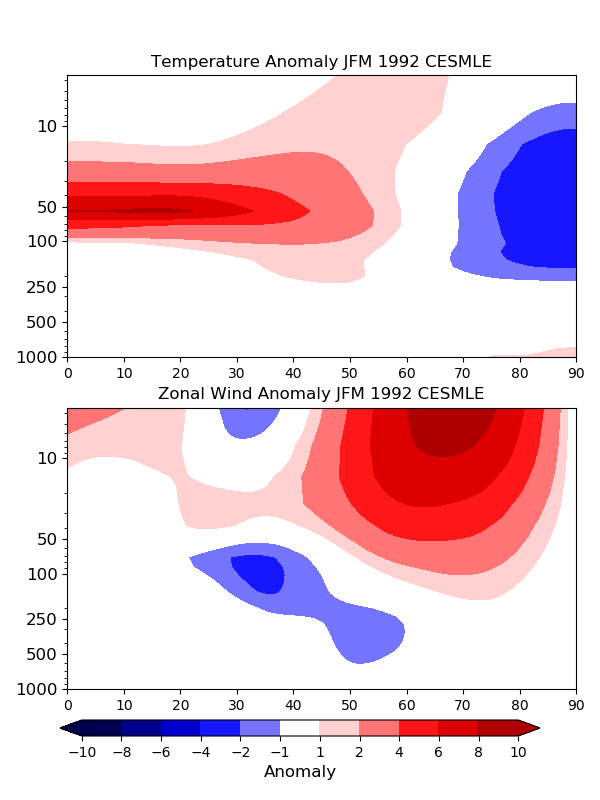
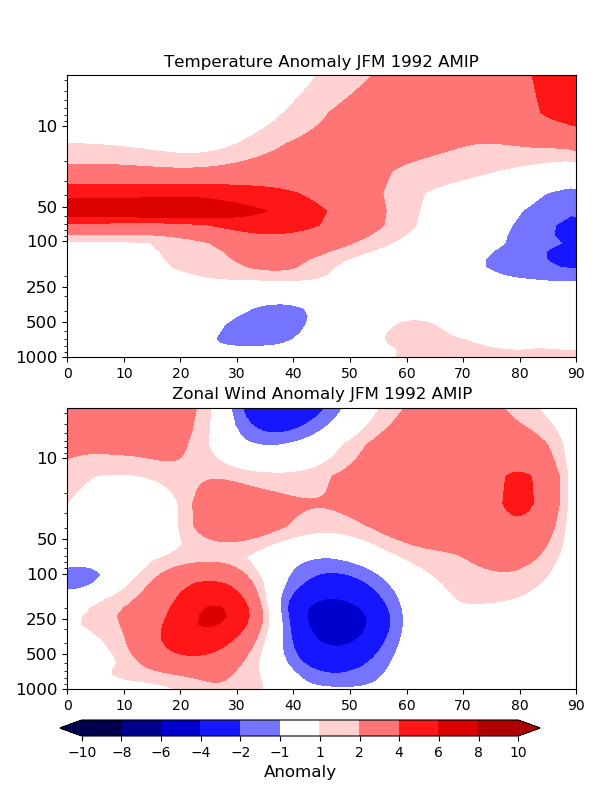
Fig. 5: Temperature anomaly profile and zonal wind anomalies in CESM-LE (42 ens) compared to AMIP-TOGA (10 ens) for each eruption.
|
|
|
|
|
|
|
|
|
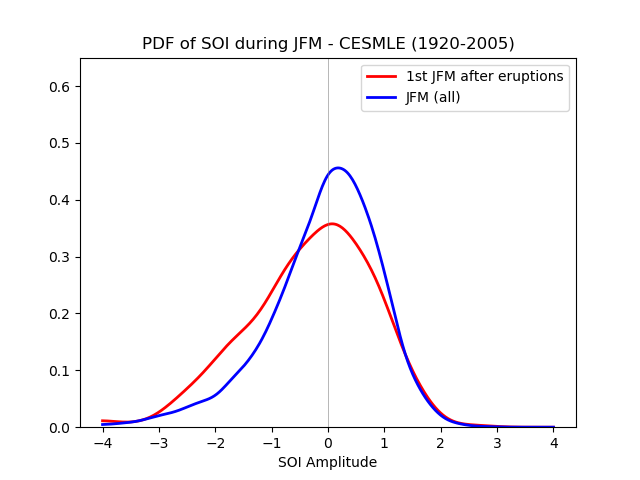
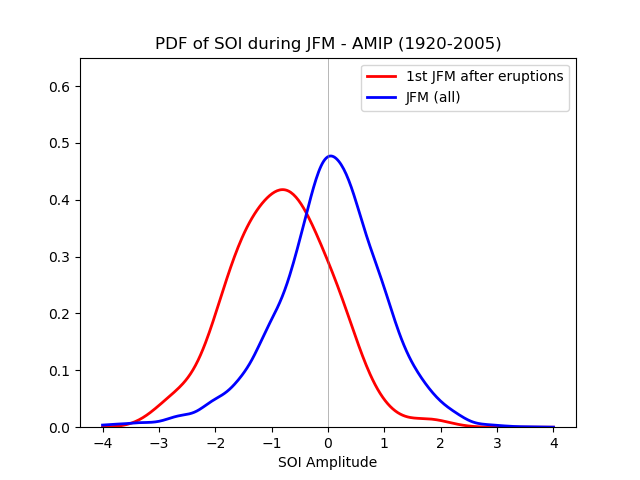
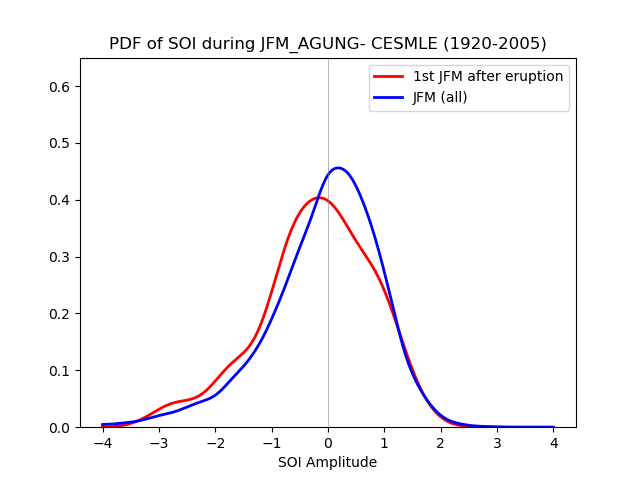
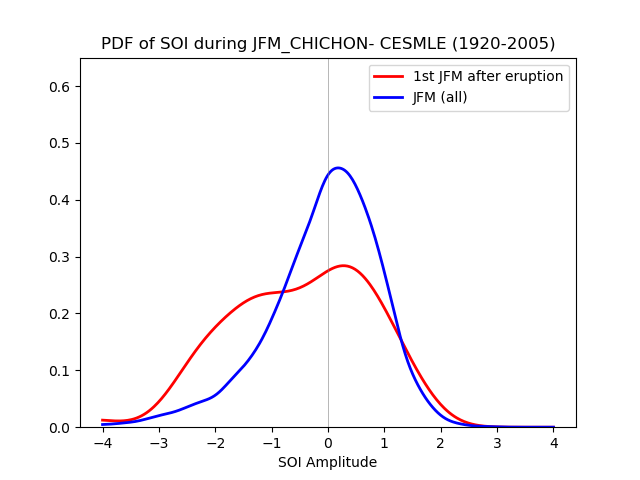
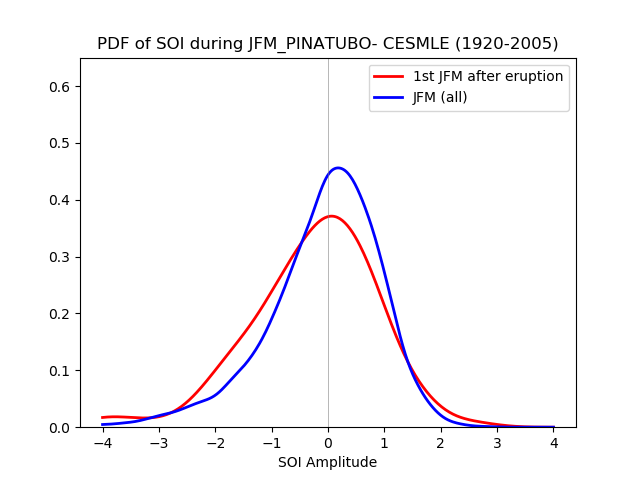
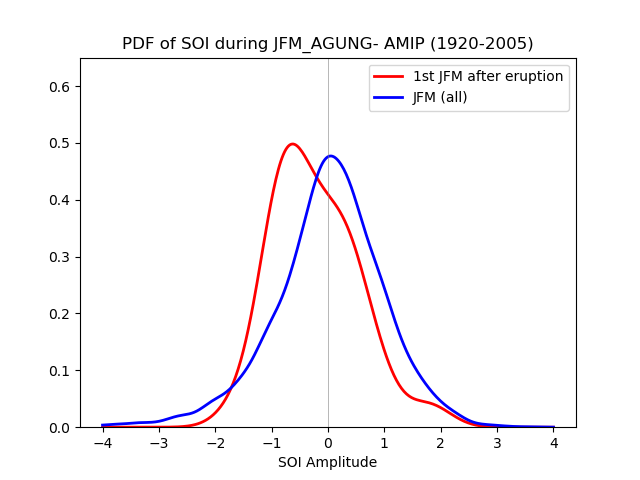
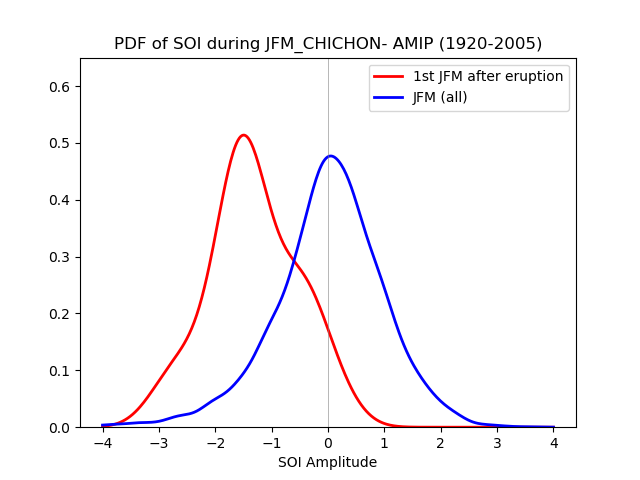
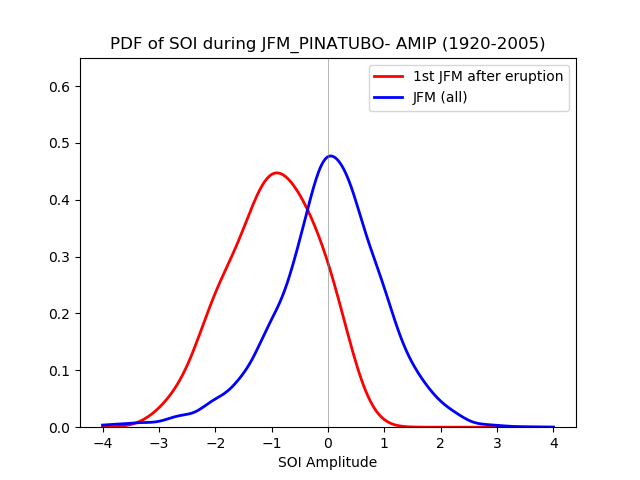
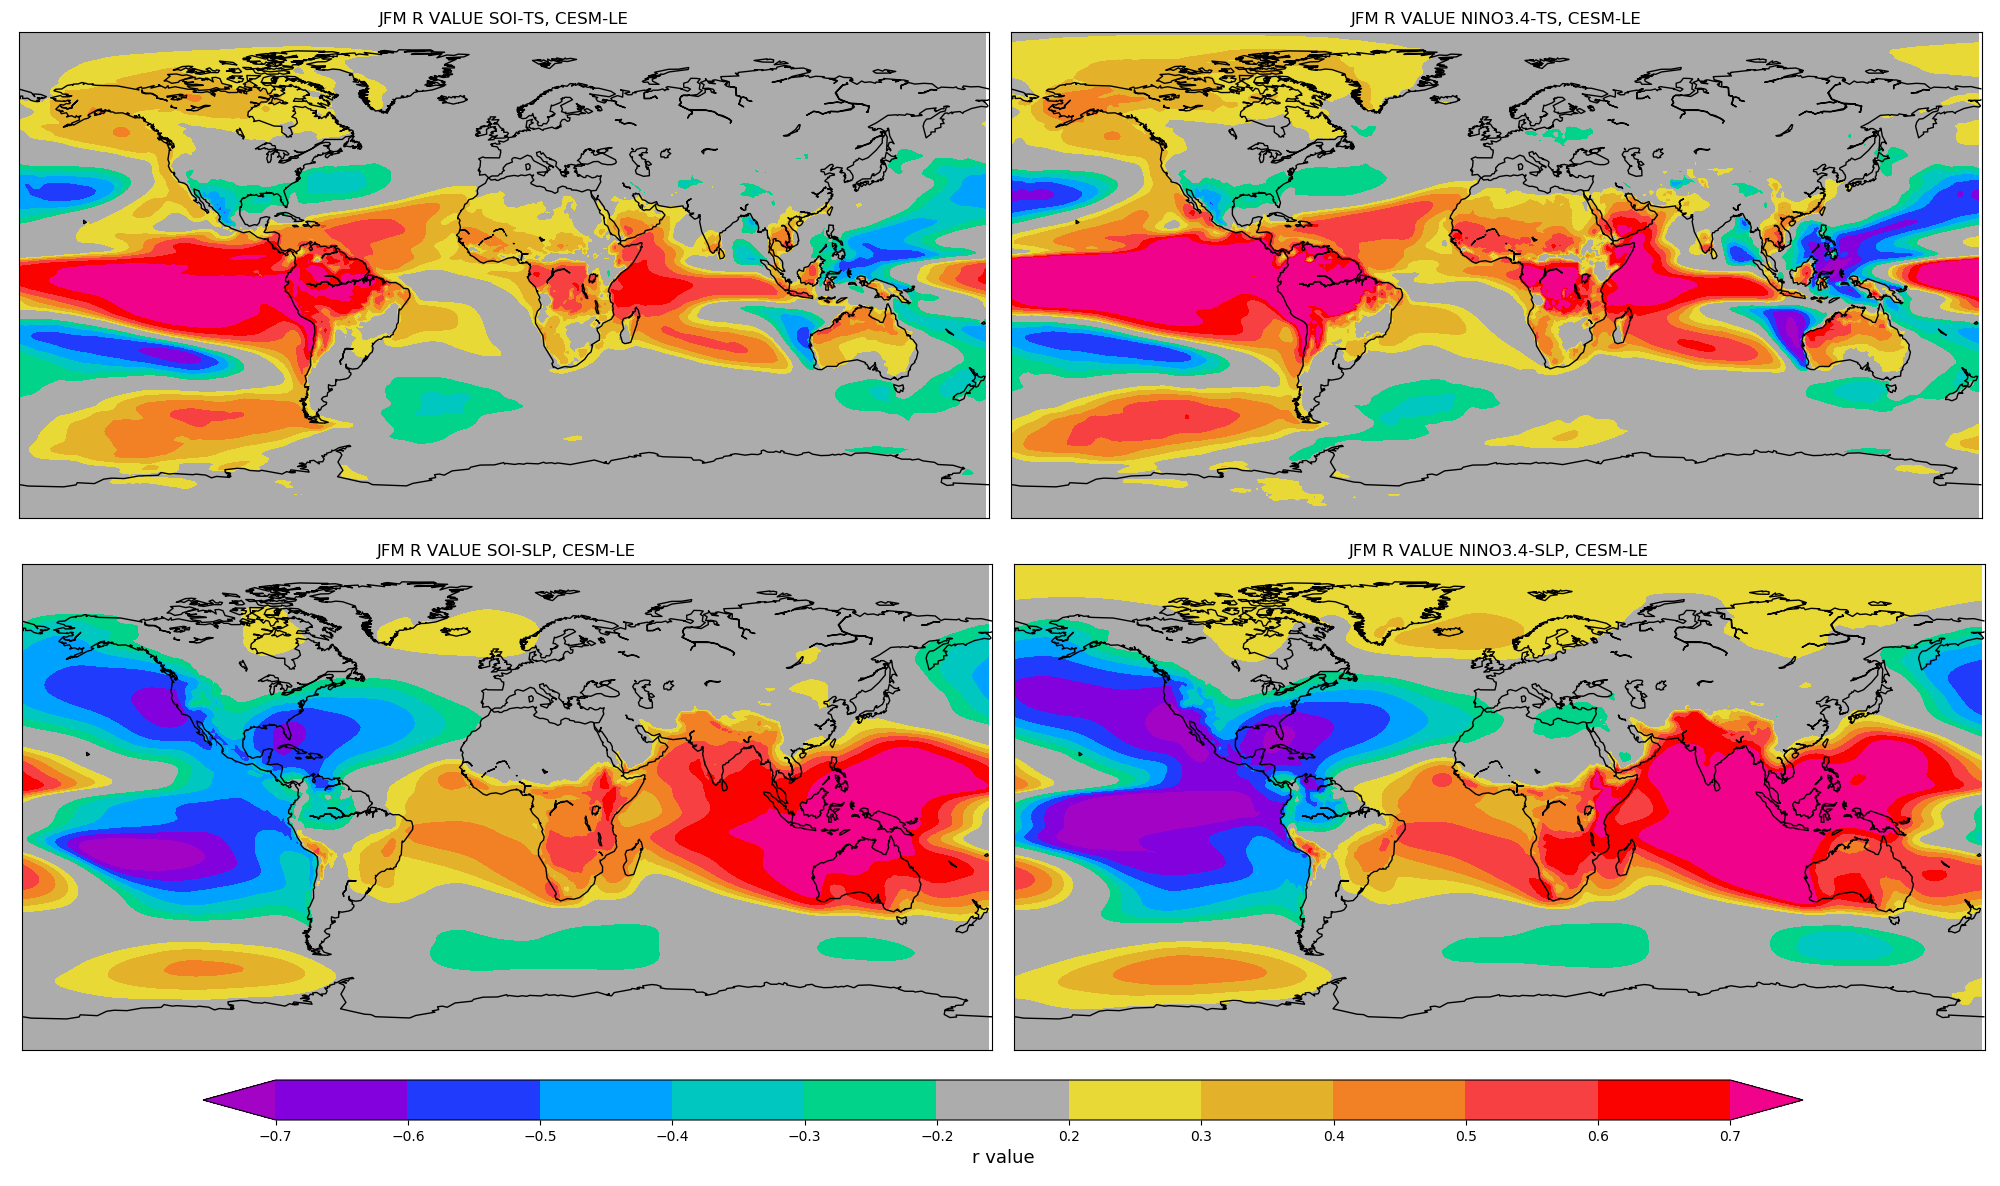
Fig. 6: PDF of SOI during JFM for CESM-LE and AMIP-TOGA
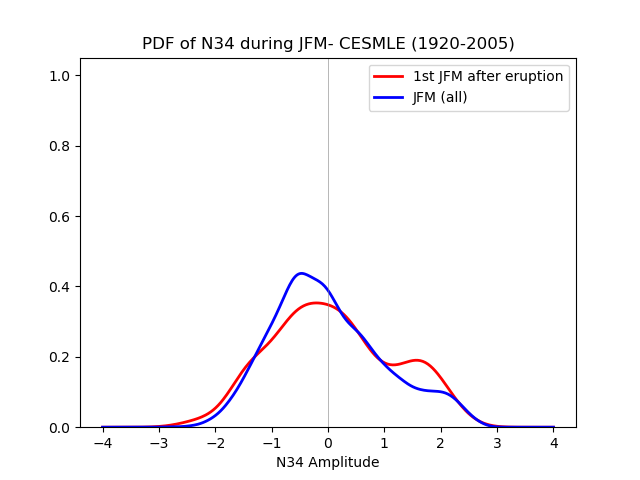
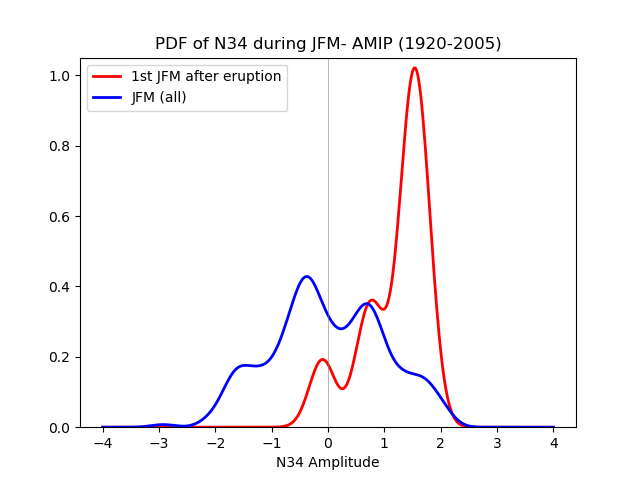
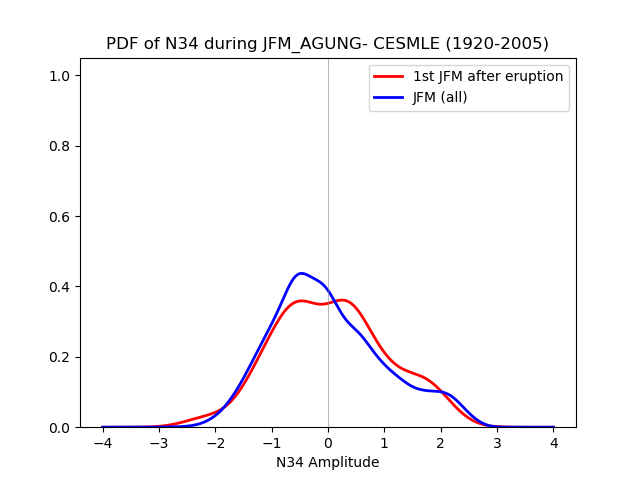
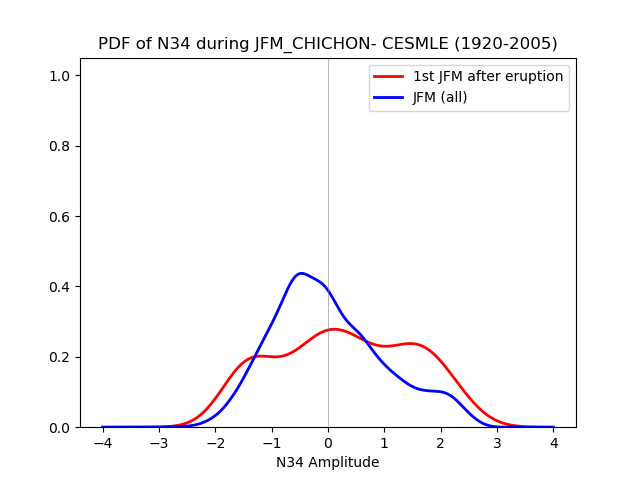
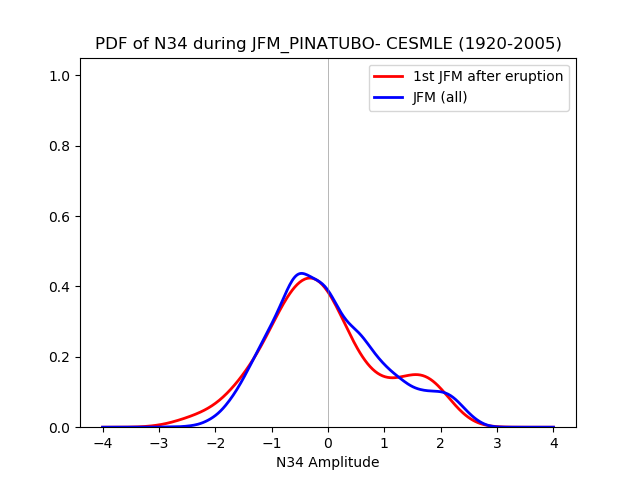
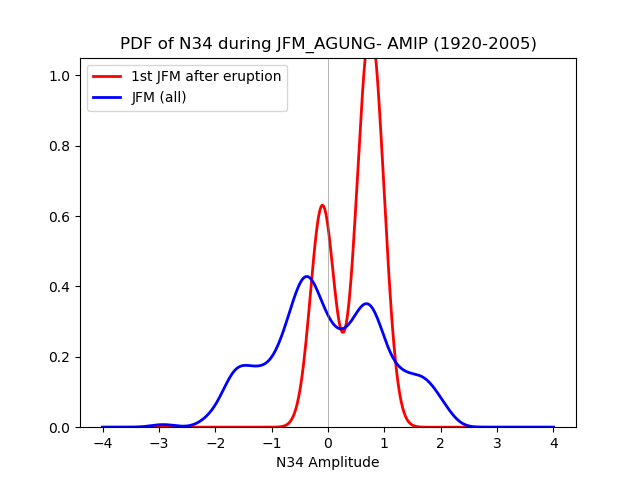
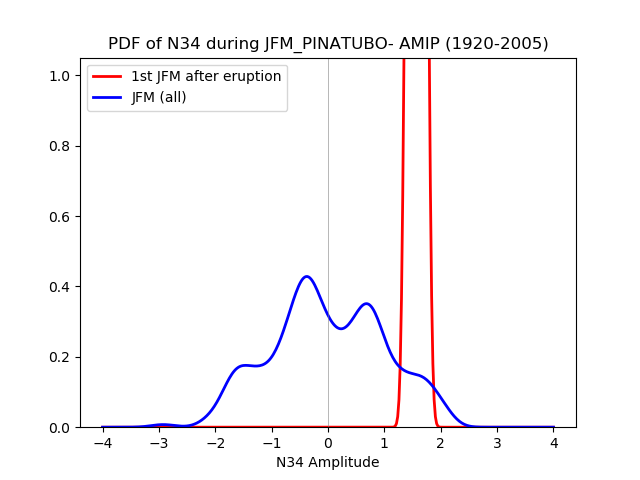
Fig. 7: PDF of Niño3.4 region SST anomalies during JFM for CESM-LE (42 ensembles) and AMIP-TOGA (10 ensembles)
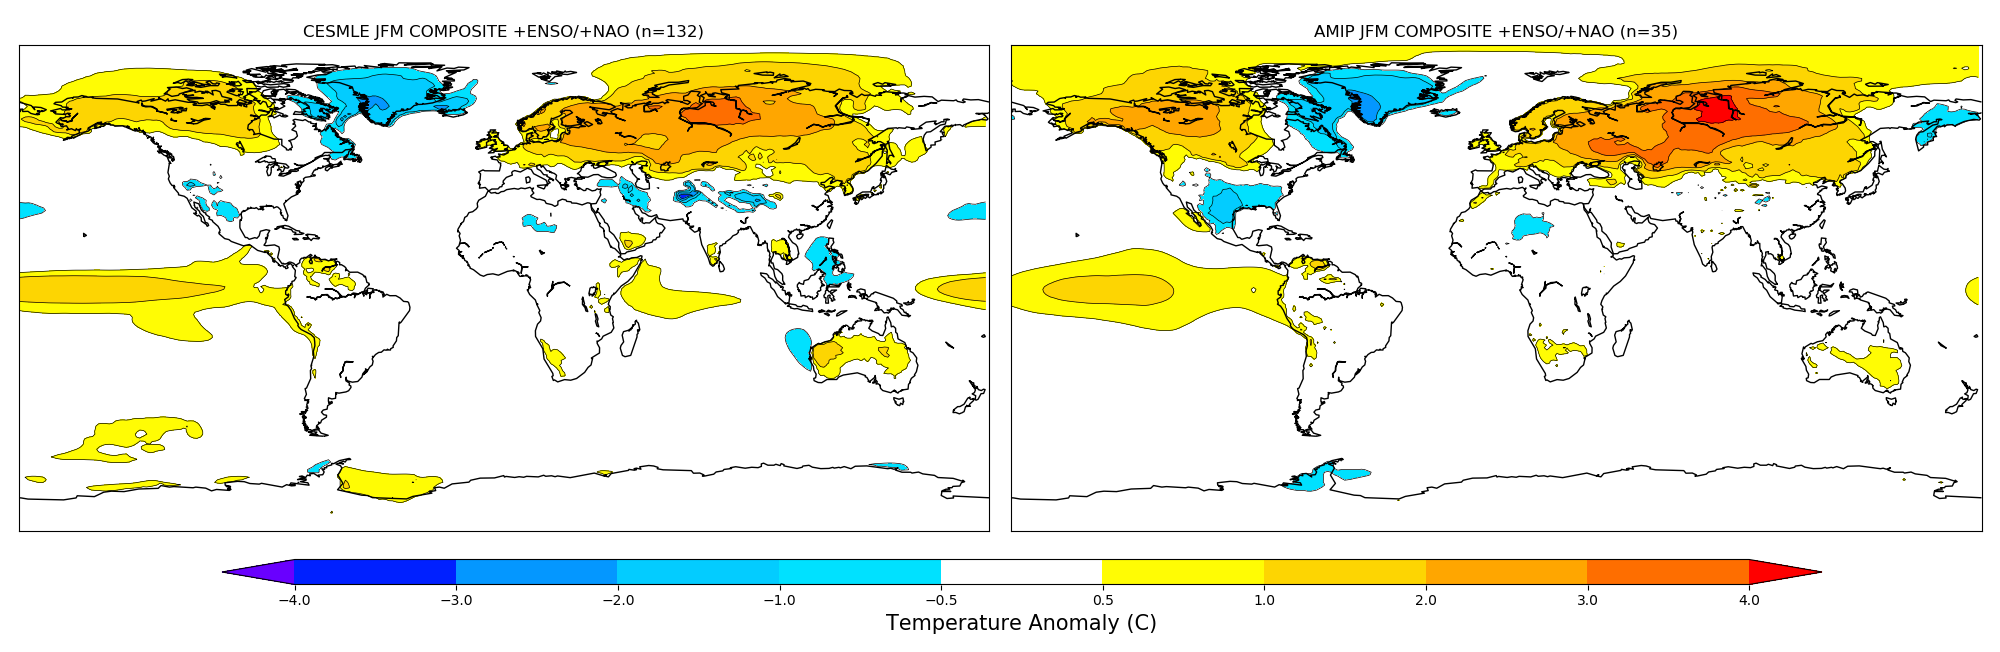
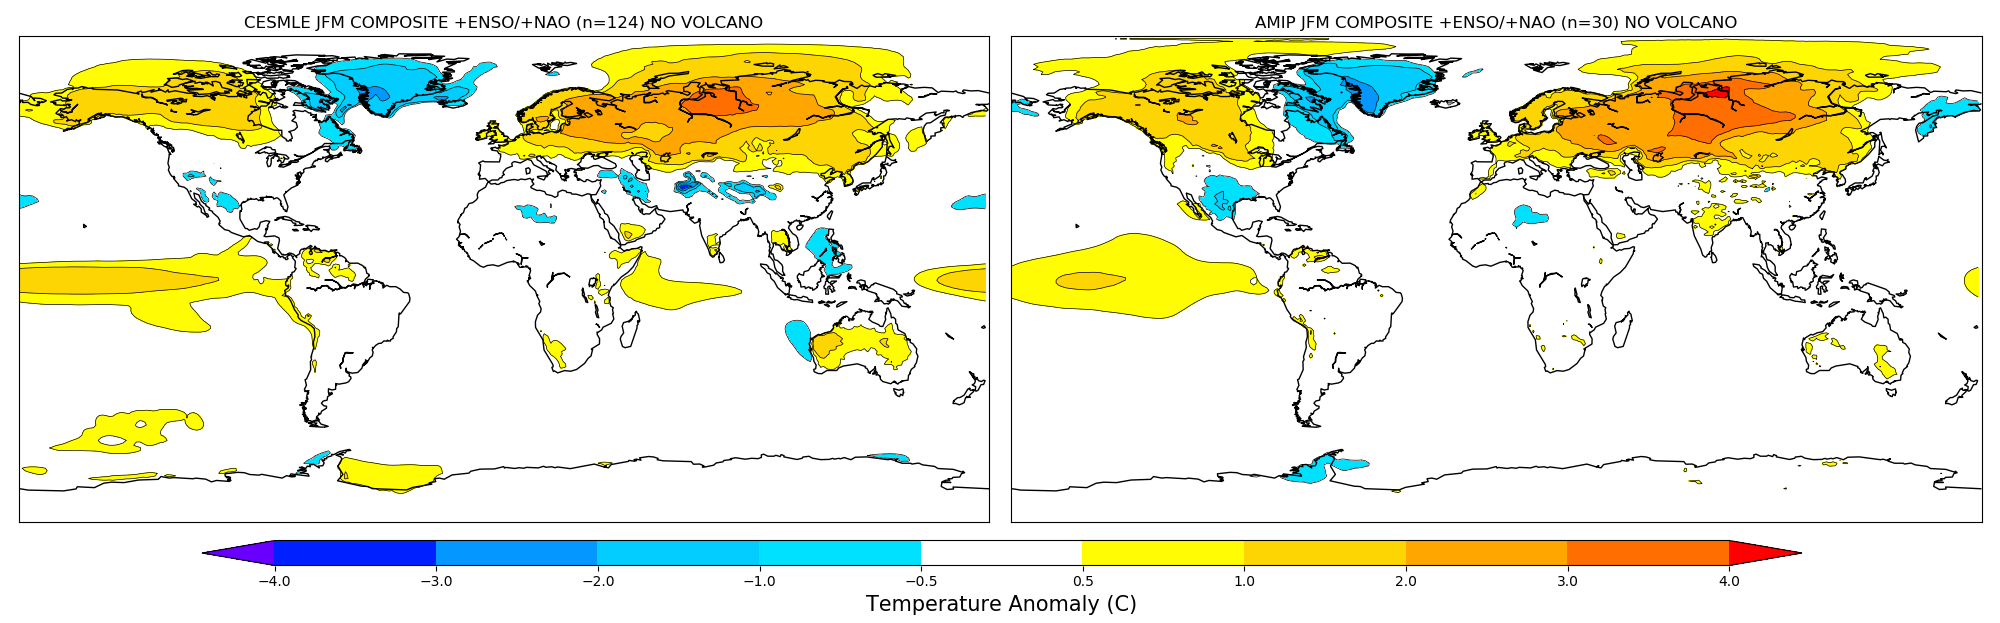
In summary, there is an increase in probability of +ENSO and +NAO in AMIP-TOGA compared to CESM-LE. The pattern of surface temperature warming in the first JFM after volcanic eruptions in observations is more consistent with the response in AMIP-TOGA compared to CESM-LE. We conclude that there is a moderate likelihood that this is due to the +NAO/+ENSO response, which the sulfate aerosols from the volcanic eruption contributes to, influencing the pattern of surface warming in the high latitude continents. We find that +NAO/+ENSO events can certainly occur in model climatology and account for approximately 4% of JFMs. When we filter out the JFM of 1964, 1983, and 1992, we find that the same proportion of JFMs have this response. There is approximately a 1 in 25 chance of any JFM having a high amplitude +NAO/+ENSO pattern. The first JFM after both the eruption of El Chichon and Pinatubo exhibit this response. It appears likely that the volcanic eruption is forcing this circulation response which contributes to warming.
Fig 8: Composite of surface temperature anomaly during +ENSO/+NAO JFMs in CESM-LE and AMIP-TOGA.
|
|
|
|
Reminder of the purely ENSO effect on surface temperature can be found here.