A Statistical Analysis of the North Atlantic Oscillation
Joshua Coupe
Computational Methods for Meteorology
Final Project
5/6/15
Attached file:
Program: NAOdata.py
Purpose: To create a program that computes the percentage of NAO+ months that correlate with at least +½ standard deviation temperature/precipitation anomalies and percentage of NAO- months correlating with at most -½ standard deviation temperature/precipitation anomalies.
Tools:
1. Use of the Climate Prediction Center’s monthly NAO index values from 1950 to present time.
2. High resolution ½ degree netcdf file with global mean monthly temperatures from 1948 to 2014.
3. High resolution ½ degree netcdf file with global mean monthly precipitation from 1900 to 2010.
Current climate theory suggests a link between the positive and negative phases of the North Atlantic Oscillation (NAO) and positive and negative temperature/precipitation anomalies. The North Atlantic Oscillation is defined as the difference between the Azores high and the Icelandic low which are semi-permanent climatological features. A positive NAO indicates a very strong pressure gradient between these two points while a negative NAO indicates a weak pressure gradient. This cycle is known to influence much of the northern hemisphere. This code analyzes how the NAO influences temperature and precipitation anomalies for any given latitude and longitude. Does the NAO have legitimate signals? This is what I aim to discover.
The code first asks the user to enter a year and a month for retrieval of the NAO at that particular month as well as the average NAO for the year. The user is given this information and then asked for the geographical location where they would like to complete the analysis. Suggested coordinates are between 35°N and 65°N and 90°E and 30°W, as the NAO’s influence is mostly in the mid-latitudes and regions bordering the Atlantic. The index in the latitude/longitude arrays corresponding to the user’s input is found by looping over the entire list of latitudes/longitudes until the difference between what the user input and a value in the lat/lon array is within ½ degrees (as the dataset’s resolution is ½ degrees).
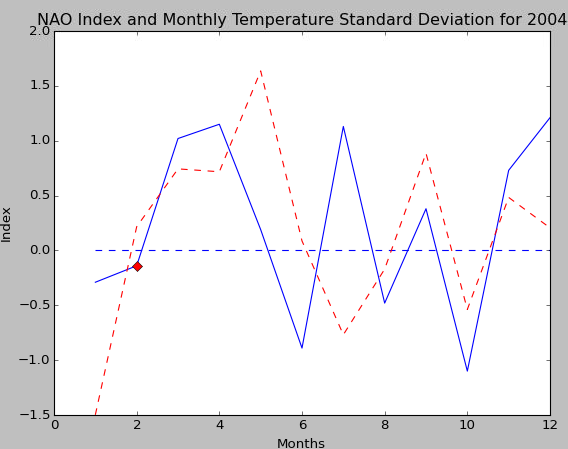
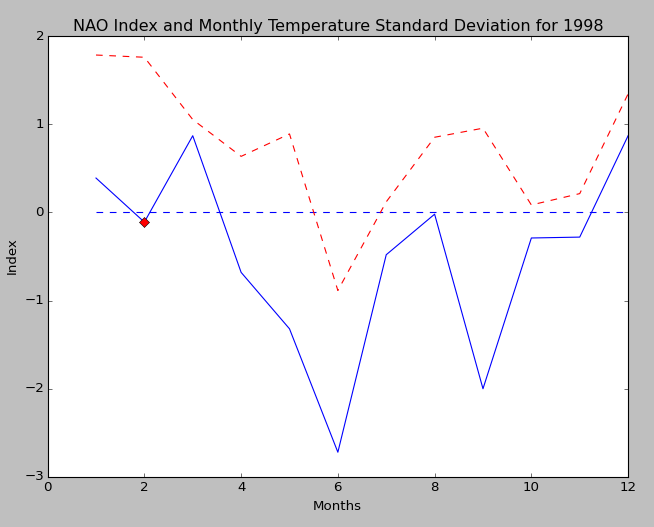
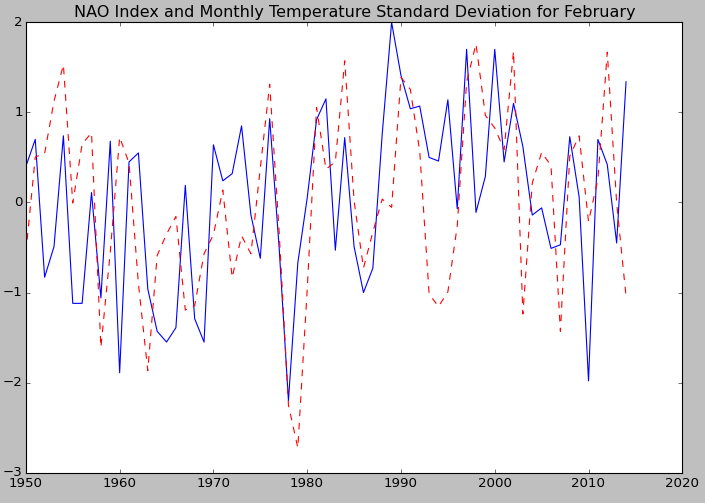
From this, the program outputs a figure with the NAO values for the year that the user gave (plotted in blue) along with the temperature standard deviation month by month for the geographic location that the user input (using red dashed lines) [Figure 1]. All figures are for New York City, as this is the default location.The dashed blue line represents zero. The user is then prompted to enter a month to perform an analysis on through the years. The user enters a number 1 through 12, so if the user enters a 2 the output will be a graph of the NAO value( in blue ) and the temperature standard deviation value(in red) for every February from 1950 to 2014. [Figure 2] The purpose of this is to show how each month responds to the NAO.
Figure 1: NAO Index (blue) and Temperature Standard Deviation (dashed red) plotted on a monthly timeseries for the years 1998 and 2004.
Figure 2: The NAO index (blue) with temperature standard deviation(dashed red) for February of 1950 to February of 2014 as a way to show how well months respond to the NAO.
The standard deviation for temperature( ) for a specific month is given by
 where
where  is the temperature amount for a month, which is constantly changing as the code cycles through an array storing mean temperature for each month.
  is the average temperature for a given month from 1950 to 2014, determined by the function monthly_average. n is the number of years in the dataset. The value returned from the function deviation_from_normal is the temperature deviation that relates to one standard deviation. To find how many standard deviations a month is away from the average, the code goes through each temperature amount once again and divides by the deviation from normal during that month to get the number of standard deviations. This is done in the sd_computation function and is how the dashed red line is calculated.
Along with plotting the time series, displayed on screen is the percentage of positive NAO months that correspond to positive temperature standard deviations greater than ½. For February, positive NAO months are more likely to have a temperature anomaly above ½ standard deviation than negative NAO months are likely to have a temperature anomaly below -½ standard deviation [Figure 3].
Figure 3: Program output indicating how positive/negative NAO indices coincide with positive/negative temperature anomalies.
--------------------------------------------
34.48 % of negative NAO months for February corresponds to a temperature decline greater than .5 standard deviation.
47.22 % of positive NAO months for February corresponds to a temperature increase greater than .5 standard deviation.
--------------------------------------------
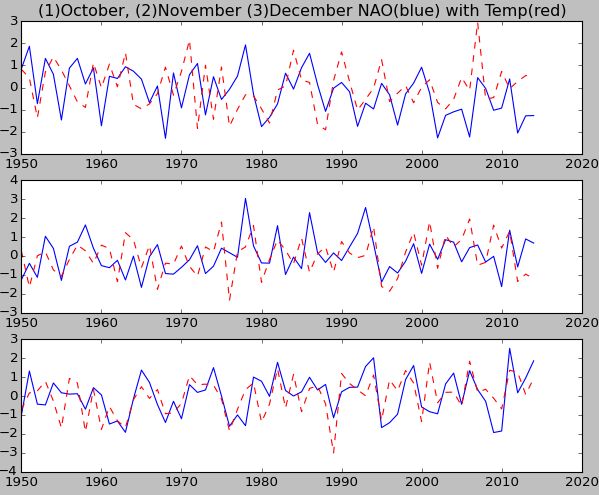
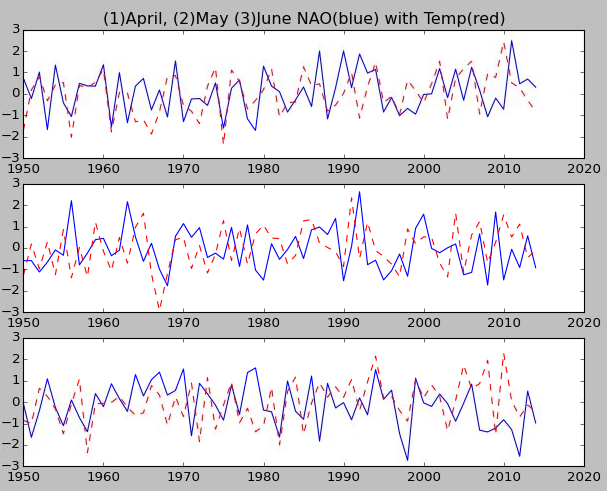
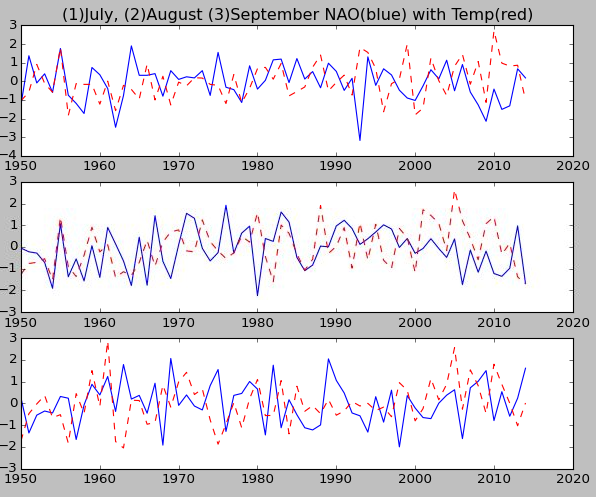
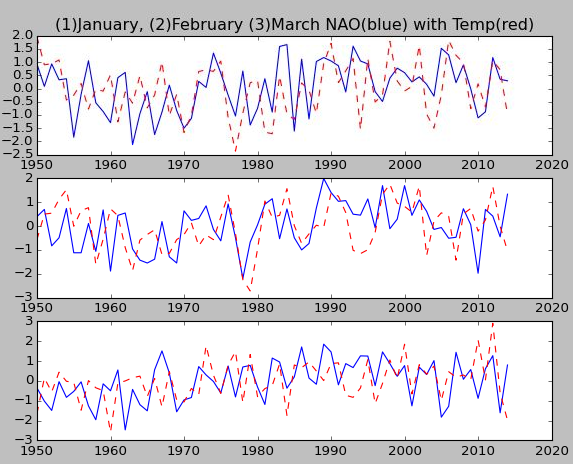
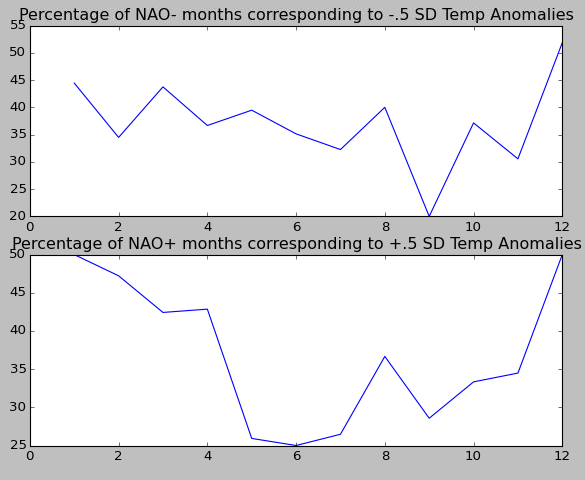
The program then gives graphical imagery of each month’s NAO(in blue) and temperature standard deviation(in red) for the time period 1950 to 2014 in sets of threes [Figure 4] using the function plotPanelCompilation. Text data is printed for every month so the user can see how well the NAO predicts temperature anomalies month by month. Then, to make the information easier to process, a plot of the percentage of months that correspond with the conditions in a positive NAO and a negative NAO is created using anomalyPlot [Figure 5].
In order for the conditions to meet the standard as a month that agrees with the NAO, for negative NAO months the temperature anomaly must deviate from the mean by at most -½ standard deviations. For positive NAO months the temperature anomaly must be more than ½ standard deviations above the mean. Percentage for NAO+ months = and percentage for NAO- months =
  . This data is computed in the statisticalAnalysis function. Note that there is a maximum percentage of NAO- correlation with temperature during December, and a maximum for NAO+ in January and December.
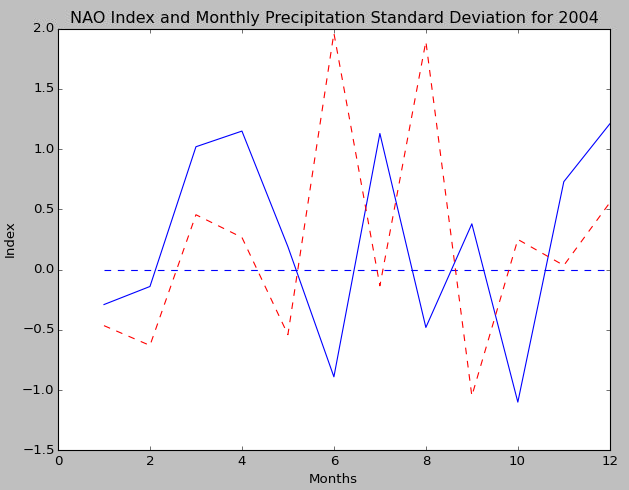
After this analysis is complete, the user is asked if they would like to compute the same analysis with precipitation. The typical conditions in a positive NAO are above average precipitation and the typical conditions in a negative NAO are below average precipitations. Upon hitting ‘y’, the same geographical data, year, and month are used to plot monthly NAO(in blue) for the year originally given along with the standard deviation of precipitation(in red) for the given month. [Figure 6] The user is then prompted to enter a new month to analyze in terms of precipitation.
Figure 4: NAO index (in blue) plotted with the standard deviation of temperature (dashed red) for every month in the time series 1950 to 2014 in sets of threes.
Figure 5: Program output indicating max NAO- correlation with negative temp anomalies in December. % on y-axis and months on x-axis. NAO+ correlation with pos. temp anomalies throughout the winter.
Figure 6: Precipitation standard deviations plotted in dashed red along with the monthly NAO for the year 2014 in blue. A one month lag is displayed yet not able to be accounted for.
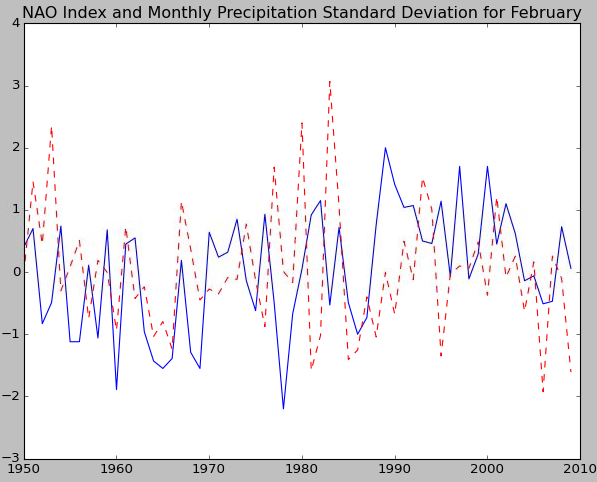
Figure 7: NAO index (in blue) with the precipitation standard deviation (dashed red) for every February from 1950 to 2010.
One intricacy about the precipitation dataset is the following: the data covers 50 more years, so the file is read starting from index 565, corresponding to January 1950 so that it links up with the temperature and NAO arrays. A variable called num_of_years is used to differentiate between the datasets when calculating the average and standard deviation of precipitation. The precipitation analysis produces the same exact plots as the temperature plots except the data does not include the years 2011 through 2014.
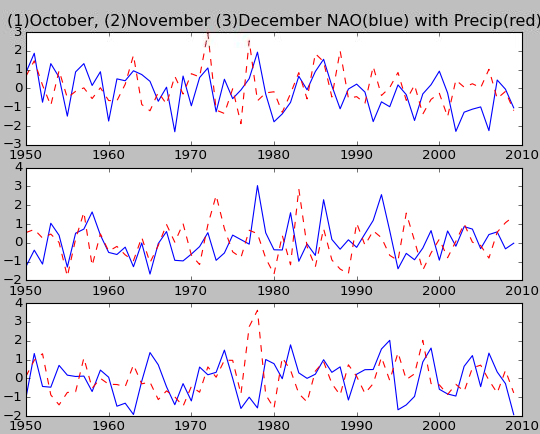
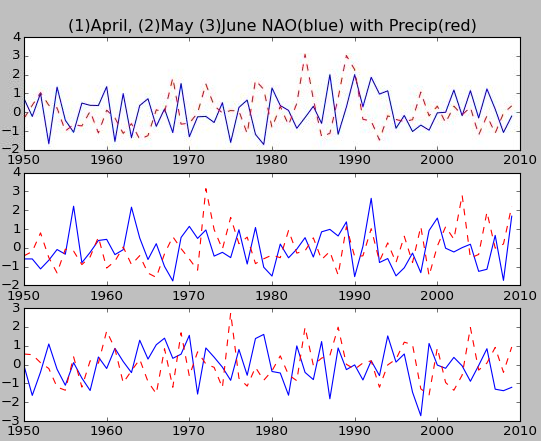
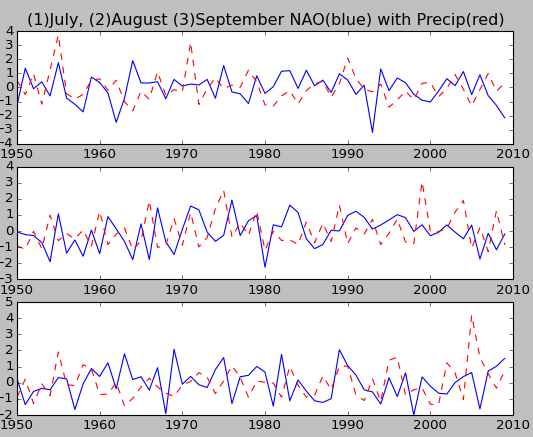
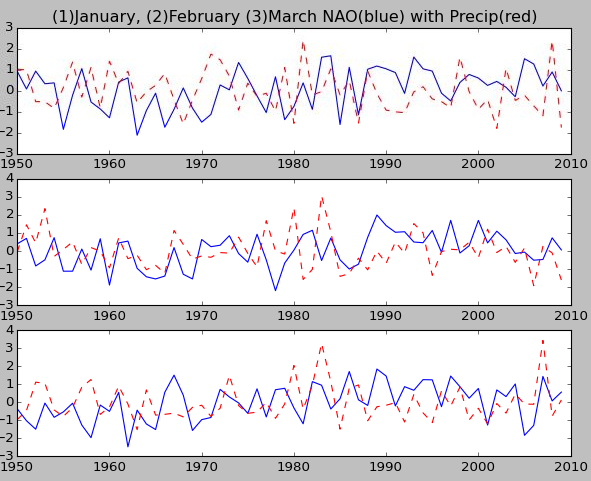
Next the codes plots the NAO indices for a single month over the years 1950 to 2010, just as was done in Figure 4 for the temperature computations [Figure 8]. Next, the percentage of NAO+ months with positive precipitation anomaly and the percentage of NAO- months with negative precipitation anomaly is calculated using ½ standard deviation as the standard for being significant. Just as for the temperature data set, the standard deviation of precipitation, , is
, is  . is then divided by the actual deviation for a specific month, yielding the number of standard deviations the precipitation was from the mean for that month.
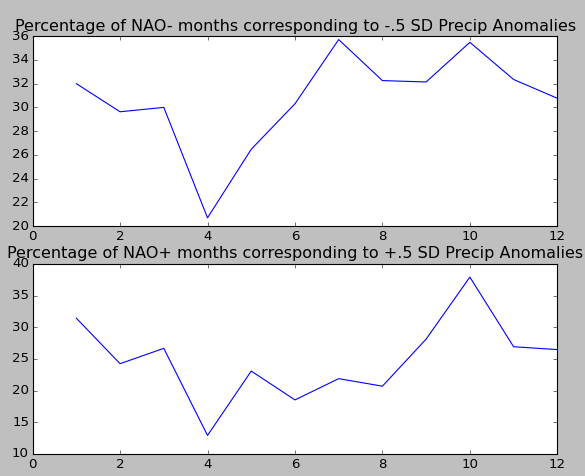
The percentages of NAO+ months corresponding to positive precipitation anomalies and NAO- months corresponding to negative precipitation anomalies are calculated using the same formulas and functions as in the temperature data. The negative NAO-negative precipitation anomaly percentage is largest in July and October. The positive NAO has a maximum correlation in October and a local maximum in January. The positive NAO has the lowest percentage of months with significant positive precipitation anomalies in April, similar to the negative NAO’s connection with precipitation.
Conclusion
The negative NAO signal on temperature anomalies is strongest during the winter time with a maximum in December and weakest with a minimum in September. The positive NAO signal on temperature anomalies is strongest in January-December and weakest with a minimum in June. The negative NAO signal on precipitation anomalies is strongest with maximums in July and October and weakest with a minimum in the chaotic month of April. The positive NAO signal on precipitation anomalies is strongest with a maximum in October and weakest with a minimum again in April. Overall, the NAO has a stronger signal with temperature anomalies, with percentages above 50%, while the precipitation anomalies maximum percentage was just above 30%.
This study did not take into account possible lags between the NAO and the standard deviation of temperature/precipitation. Graphically one can observe similar slopes in NAO value and the standard deviation of temperature that are a month apart such as in Figure 6, indicating potential further correlation. Accounting for this would add complexity that is beyond the scope of this project.
Figure 8: NAO index (in blue) plotted with the standard deviation of precipitation (dashed red) for every month in the time series 1950 to 2010.
Figure 9: Program output indicating max NAO- correlation with negative precip anomalies in July and October. NAO+ correlation with positive precip anomalies found in October and January. % on y-axis and months on x-axis.
Text Output from NAOData.py
[jlc449@cat5 FinalNAO]$ python NAOdata.py
Given a year and date, this program will tell you the NAO index for that time as well as give you the plot of NAO vs. temperature standard deviation with time.
Enter a year after 1950 you would like NAO data for:
2003
Now enter the month: (enter 01 for Jan, 02 for Feb, etc.)
12
The NAO for 12 / 2003 is 0.64 .
The average NAO value for this year is 0.098
*****************************************************************
To compare the NAO with temperature, we recommend a latitude bordering the West Atlantic.
Boston is 42.36 N and -71.06 ; NYC is 40.71 N and - 74.0059
Enter a latitude between -90 and 90:42.36
For longitude, note that west of 0 degrees is negative.
Enter a longitude between -180(east) and 180(west):-71.06
NOTICE: In all multi-lined plots, blue represents NAO values and red represents standard deviation
Some months show a stronger NAO signal than others. This section will inform you as to how the month you enter correlates with temperature standard deviation.
Enter a month to find out how temperature relates to the NAO for that month:
12
--------------------------------------------
37.04 % of negative NAO months for December corresponds to a temperature decline greater than .5 standard deviation.
39.47 % of positive NAO months for December corresponds to a temperature increase greater than .5 standard deviation.
--------------------------------------------
============================================================
COMPUTING STATISTICAL ANALYSIS FOR EVERY MONTH (1950 - 2014)
============================================================
--------------------------------------------
33.33 % of negative NAO months for January corresponds to a temperature decline greater than .5 standard deviation.
50.0 % of positive NAO months for January corresponds to a temperature increase greater than .5 standard deviation.
--------------------------------------------
--------------------------------------------
34.48 % of negative NAO months for February corresponds to a temperature decline greater than .5 standard deviation.
41.67 % of positive NAO months for February corresponds to a temperature increase greater than .5 standard deviation.
--------------------------------------------
--------------------------------------------
34.38 % of negative NAO months for March corresponds to a temperature decline greater than .5 standard deviation.
42.42 % of positive NAO months for March corresponds to a temperature increase greater than .5 standard deviation.
--------------------------------------------
--------------------------------------------
40.0 % of negative NAO months for April corresponds to a temperature decline greater than .5 standard deviation.
45.71 % of positive NAO months for April corresponds to a temperature increase greater than .5 standard deviation.
--------------------------------------------
--------------------------------------------
42.11 % of negative NAO months for May corresponds to a temperature decline greater than .5 standard deviation.
33.33 % of positive NAO months for May corresponds to a temperature increase greater than .5 standard deviation.
--------------------------------------------
--------------------------------------------
29.73 % of negative NAO months for June corresponds to a temperature decline greater than .5 standard deviation.
42.86 % of positive NAO months for June corresponds to a temperature increase greater than .5 standard deviation.
--------------------------------------------
--------------------------------------------
32.26 % of negative NAO months for July corresponds to a temperature decline greater than .5 standard deviation.
29.41 % of positive NAO months for July corresponds to a temperature increase greater than .5 standard deviation.
--------------------------------------------
--------------------------------------------
37.14 % of negative NAO months for August corresponds to a temperature decline greater than .5 standard deviation.
30.0 % of positive NAO months for August corresponds to a temperature increase greater than .5 standard deviation.
--------------------------------------------
--------------------------------------------
26.67 % of negative NAO months for September corresponds to a temperature decline greater than .5 standard deviation.
31.43 % of positive NAO months for September corresponds to a temperature increase greater than .5 standard deviation.
--------------------------------------------
--------------------------------------------
40.0 % of negative NAO months for October corresponds to a temperature decline greater than .5 standard deviation.
33.33 % of positive NAO months for October corresponds to a temperature increase greater than .5 standard deviation.
--------------------------------------------
--------------------------------------------
33.33 % of negative NAO months for November corresponds to a temperature decline greater than .5 standard deviation.
37.93 % of positive NAO months for November corresponds to a temperature increase greater than .5 standard deviation.
--------------------------------------------
--------------------------------------------
37.04 % of negative NAO months for December corresponds to a temperature decline greater than .5 standard deviation.
39.47 % of positive NAO months for December corresponds to a temperature increase greater than .5 standard deviation.
--------------------------------------------
Continue analysis with precipitation? (y/n)
y
Enter a month to find out how precipitation correlates with the NAO through the years(1950-2010):
12
--------------------------------------------
23.08 % of negative NAO months for December corresponds to a precipitation decline greater than .5 standard deviation.
26.47 % of positive NAO months for December corresponds to a precipitation increase greater than .5 standard deviation.
--------------------------------------------
--------------------------------------------
28.0 % of negative NAO months for January corresponds to a precipitation decline greater than .5 standard deviation.
22.86 % of positive NAO months for January corresponds to a precipitation increase greater than .5 standard deviation.
--------------------------------------------
--------------------------------------------
22.22 % of negative NAO months for February corresponds to a precipitation decline greater than .5 standard deviation.
21.21 % of positive NAO months for February corresponds to a precipitation increase greater than .5 standard deviation.
--------------------------------------------
--------------------------------------------
33.33 % of negative NAO months for March corresponds to a precipitation decline greater than .5 standard deviation.
26.67 % of positive NAO months for March corresponds to a precipitation increase greater than .5 standard deviation.
--------------------------------------------
--------------------------------------------
17.24 % of negative NAO months for April corresponds to a precipitation decline greater than .5 standard deviation.
22.58 % of positive NAO months for April corresponds to a precipitation increase greater than .5 standard deviation.
--------------------------------------------
--------------------------------------------
35.29 % of negative NAO months for May corresponds to a precipitation decline greater than .5 standard deviation.
26.92 % of positive NAO months for May corresponds to a precipitation increase greater than .5 standard deviation.
--------------------------------------------
--------------------------------------------
39.39 % of negative NAO months for June corresponds to a precipitation decline greater than .5 standard deviation.
25.93 % of positive NAO months for June corresponds to a precipitation increase greater than .5 standard deviation.
--------------------------------------------
--------------------------------------------
46.43 % of negative NAO months for July corresponds to a precipitation decline greater than .5 standard deviation.
31.25 % of positive NAO months for July corresponds to a precipitation increase greater than .5 standard deviation.
--------------------------------------------
--------------------------------------------
38.71 % of negative NAO months for August corresponds to a precipitation decline greater than .5 standard deviation.
20.69 % of positive NAO months for August corresponds to a precipitation increase greater than .5 standard deviation.
--------------------------------------------
--------------------------------------------
28.57 % of negative NAO months for September corresponds to a precipitation decline greater than .5 standard deviation.
28.13 % of positive NAO months for September corresponds to a precipitation increase greater than .5 standard deviation.
--------------------------------------------
--------------------------------------------
32.26 % of negative NAO months for October corresponds to a precipitation decline greater than .5 standard deviation.
37.93 % of positive NAO months for October corresponds to a precipitation increase greater than .5 standard deviation.
--------------------------------------------
--------------------------------------------
26.47 % of negative NAO months for November corresponds to a precipitation decline greater than .5 standard deviation.
30.77 % of positive NAO months for November corresponds to a precipitation increase greater than .5 standard deviation.
--------------------------------------------
--------------------------------------------
23.08 % of negative NAO months for December corresponds to a precipitation decline greater than .5 standard deviation.
26.47 % of positive NAO months for December corresponds to a precipitation increase greater than .5 standard deviation.
--------------------------------------------