Eddy Characteristics in an Ocean Model Reanalysis
by
Joshua Coupe ‘16
A thesis submitted to the Honors Committee of the
School of Environmental and Biological Sciences, Rutgers University
in partial fulfillment of the requirements of
The George H. Cook Scholars Program
Written under the direction of
Professor Enrique Curchitser
Of the Department of Environmental Sciences
New Brunswick, NJ
04/01/2016
Eddy Characteristics in an Ocean Model Reanalysis
I have reviewed the project conducted by Joshua Coupe and
I endorse its consideration for the George H. Cook Scholar award.
_____________________________
Enrique Curchitser, Project Advisor
Dept. of Environmental Sciences
_____________________________
Annmarie Carlton, Reader
Dept. of Environmental Sciences
Eddy Characteristics in an Ocean Model Reanalysis
Joshua Coupe
ABSTRACT
An eddy detection and tracking algorithm is applied to a global ocean reanalysis dataset to develop statistics of eddy characteristics in both the Gulf Stream and Kuroshio current. Number, size, and intensity of eddies is explored in conjunction with the seasonal and interannual variability of the positioning of both the Gulf Stream and Kuroshio Current. In both current systems, the northward mode of the current positioning leads to less eddy activity, suppressing anticyclonic eddy development. During the southern mode of positioning, eddy activity is enhanced, particularly cyclonic eddies. The climate modes that influence the shifting of the positions of the Gulf Stream and Kuroshio current are explored with the determination that the shifts in both currents are associated with a number of non-linear processes. As the correlation between current positioning and eddy activity is not very strong, a correlation between a climate mode and eddy characteristics is even weaker.
Introduction
Eddies in the atmosphere and ocean are the result of the transfer of momentum and energy of a fluid from large- to small-scales. Because of their chaotic nature, their dynamics are difficult to model accurately. In ocean dynamics, understanding the tendencies of flow, spatial distribution, and energy of mesoscale eddies can be critical to the biological and physical mechanisms that define an ecosystem and/or climate (Chaudhuri et al., 2009). With this context in mind, investigating eddies that originate from the Gulf Stream and Kuroshio Current is crucial to understanding the dynamics of both the northwestern Atlantic and northwestern Pacific and the regional climate impacts. The Gulf Stream is not only one of the most conspicuous and well-known western boundary currents in the world, but with its location just miles from the coastal United States, its regional signature is linked to the weather, climate and ocean-related livelihood of tens of millions of people (Chaudhuri et al., 2009). The Kuroshio Current is analogous to the Gulf Stream and has many of the same impacts in the northwestern Pacific.
Understanding the role of Gulf Stream eddies in connecting the large-scale ocean circulation to the continental shelf is of primary importance. Utilizing the eddy techniques developed by the Curchitser Earth System Modeling Lab at Rutgers University as described in the paper Gulf Stream eddy characteristics in a high-resolution ocean model [Kang and Curchitser, 2013], as well as the techniques developed by others before them, an analysis of the seasonal as well as interannual variability of eddy characteristics in the northern Atlantic Ocean and north Pacific Oceans between 1993 and 2012 will be performed. These techniques range from computing the Okubo-Weiss parameter across a region, which is a relationship between stress, shearing, and relative vorticity of the flow- to geometric analysis of the velocity vectors that characterize the flow, or the currents (Kang and Curchitser, 2013). These techniques have been shown to have high-fidelity and limit false detection. Once the characteristics of the eddies have been adequately assessed, the variability in these characteristics from year to year will be explored, ultimately making a connection to the large-scale climate.
The groundwork for such research in the Gulf Stream region has been laid by Curchitser and others [Isern-Fontanet et al., 2003; Morrow et al., 2004; Chelton et al., 2007] , who have reported on the seasonal variability in eddy characteristics such as size, duration, number, and kinetic energy. All of these characteristics have a variability that can be linked to a forcing mechanism, though it is not always completely understood. In a step towards a climate link, Chaudhuri’s (2009) paper Interannual variability of Gulf Stream warm-core rings in response to the North Atlantic Oscillation analyzes the interannual variability of anti-cyclonic eddies of the Gulf Stream and attempts to link this to the climate phenomenon known as the North Atlantic Oscillation (NAO). It is not fully determined whether the reported variability is indeed due to forcing by the NAO or simply interannual variability in response to some other forcing mechanism.
The North Atlantic Oscillation is a climatological index, which is defined as the difference in pressure over the quasi-fixed Icelandic low and Azores high (CPC). A positive NAO value indicates a strong pressure gradient between these two points and a negative NAO indicates a weaker pressure gradient, as determined by Barnton and Livezey (1987). The NAO has significant implications for how the atmospheric jet stream acts, which has a significant signature in the climate of the mid-latitudes (CPC). The NAO is a known forecasting tool for many aspects of the northern hemisphere but it is of primary importance here due to its effect on mean wind speeds across the Gulf Stream region (CPC). A positive NAO has been shown to increase the mean wind speeds over the North Atlantic Ocean (Chaudhuri et al., 2009). Following the logic of current theory, increased wind speeds over time leads to increased surface wind stress which would force higher eddy kinetic energy across the area affected, discounting topographical limitations such as the continental shelf’s proximity to the northwest wall of the Gulf Stream (Kang and Curchitser, 2013).
Establishing a link in a hypothetical process with numerous steps is in some way beyond the scope of this paper. Ultimately, atmospheric forcing and the relationship it has with ocean eddies is complex. The link between eddies and the NAO, represented by the atmospheric forcing that induces eddy development is compounded by various other connections that drive eddy variability (Chaudhuri et al., 2009). Much of the variability in eddy characteristics examined can be attributed to changes in the positioning of either the Gulf Stream/Kuroshio current, which can be linked to a number of different factors [(Perez-Hernandez, 2014) (Sekine et al., 1994)]. The eddy statistics in this paper are provided to increase understanding of Gulf Stream region eddies as well as Kuroshio current eddies and suggest links to larger scale variability. Beyond physical characteristics, eddies can induce upwelling and increase the biological productivity of an environment by introducing nutrients to the mixed layer (Chelton et al., 2007). Understanding how eddies are characterized in two of the most predominant western boundary currents has biological and climatological implications. Comparing the two current systems enhances the understanding of coupled atmospheric and ocean systems.
Methods and data
To examine interannual eddy characteristics as well as examining a possible climate link, comprehensive reanalysis model output detailing ocean conditions averaged daily from 1993 to 2012 titled ‘GLORYS2V1’ is used [Ferry et al., 2009]. At ¼ degree resolution, the reanalysis is an extremely powerful tool, which assimilates observations and has been validated to accurately represent the dynamics of the regions [Ferry et al., 2009]. An algorithm for eddy detection and tracking from a study using a higher resolution ocean model was refitted for this ¼ degree resolution model. This algorithm is based on three major constraints: Sea surface heights (SSH) field, the Okubo-Weiss parameter, and geometric constraints based on the velocity field. The algorithm is refitted to this lower resolution dataset from the work done in Kang and Curchitser (2013).
The maxima and minima points of the SSH field are calculated to determine anticyclonic and cyclonic eddies, respectively. Generally, an anticyclonic eddy is characterized by the depression of the thermocline and a warm signature; the response of the SSH field is to bulge upwards at the center of the eddy (Chaigneau et al., 2008). A cyclonic eddy is characterized by the opposite- a thermocline bulging upwards and a SSH field depression at the center of the eddy. There are exceptions to the rule near the coast, but for a long term dataset, these exceptions are not significant in number. Next, the Okubo Weiss parameter is calculated as a determination of the dominance of deformation with respect to rotation (vorticity) of the flow, where
OW =
The OW parameter is thus the square of the normal components of strain added to the square of the shear components of strain and then subtracting the square of the relative vorticity of the flow. The variable u is the west-east component of the velocity and v is the north-south component of velocity. The OW parameter allows one to partition the flow into different regimes and calculate the area of an eddy. The vortex core which defines the areal extent of the eddy is all points of the flow where OW is less than OW₀ where OW₀ is 0.2𝜎OW. 𝜎OW is the spatial standard deviation of the OW parameter, quantifying the variability in OW with respect to space and time.
Unfortunately, the OW parameter has been shown to have a high rate of false detection (Kang and Curchitser, 2013). To increase the reliability of the detection algorithm, we employ geometric constraints based on the local minima point in the velocity field of the flow. Along the east-west axis across the eddy center, the v velocity vector must reverse in sign. Along the north-south axis across the eddy center, the u velocity vector must also reverse in sign as well. Additionally, the sign of vorticity must remain constant around the eddy center, indicating the entire eddy is rotating in the same direction. Finally, the ratio of maximum and minimum of the velocity magnitude must be smaller than a threshold, which has been defined as 5. This is the same value used in the algorithm for the higher resolution reanalysis, only because 4 was too exclusionary. These constraints allow for eddies of many shapes ranging from perfect circles to elliptical shapes to be detected. The detection algorithm is run in both the regions along the Gulf Stream as well as the Kuroshio Current and eddy centers are stored for every day from January 1st, 1993 to December 31st, 2012.
After the detection, a tracking algorithm is employed to follow the evolution of eddies longer than 15 days. The detection algorithm is as follows. At t = 0 days, detected eddy center number 1 (Eddy #1) for that day has its coordinates logged. The coordinates of Eddy #1 are compared with the detected eddy centers at t+1 days. If an eddy center is detected within a 6 x 6 box that is centered around the starting coordinates of Eddy #1, the coordinates are recorded in Eddy #1’s history as being day two of that eddy. If no eddy center is detected at t+1 days, a flag is recorded in anticipation of the eddy’s dissipation. The detected eddy centers for day t+2 are compared and the same box is used to determine if the eddy still exists. If at day t+1 there was no detected eddy center within the region and again at day t+2 there is still no detected eddy center within the region, the record of the eddy stops and is assumed to have dissipated. Therefore, if an existing eddy shows two days with no detected eddy center, it stops. When the eddy dissipates, the algorithm goes back to t = 0 days to examine Eddy #2 and repeat the process. When every detected eddy center from day t=0 is tracked, every eddy from day t=1 is tracked. This means there will be many duplicate eddies which are deleted from the record afterward all the eddies for the 20 year period are tracked. Finally, the only eddies used in this study last longer than 15 days, as was one in KC2013.
A number of eddy characteristics will be examined on seasonal and interannual timescales to understand the dynamics of Gulf Stream and Kuroshio Current eddies. Eddy radius, intensity, spatial distribution, and distance will be explored. The radius of the eddy is determined by defining the eddy as the closed contour of OW₀ = 0.2𝜎OW . where 𝜎OW is one standard deviation of the OW field. The area within this contour is the area of the eddy (A). The radius is then computed as  . The intensity of the eddy is calculated as
  / f. is the absolute mean relative vorticity within the boundary of the eddy and f is the Coriolis parameter, which at mid-latitudes we use a constant 7.3 x 10
 , as was used in a number of studies [Kang and Curchitser 2013; Chaigneau et al., 2008].
To try and determine a connection between climatological or atmospheric forcing and eddy characteristics in, the GLORYS dataset in the Gulf Stream region is compared with the NOAA’s Climate Prediction Center’s monthly NAO calculation(CPC). It has been suggested in the literature that increased mean wind speed over the ocean increases eddy kinetic energy over long timescales, although the mechanisms for this occurrence are not completely understood (Isern-Fontanet et al., 2003). Additionally, the position of the Kuroshio current is used to understand variations in eddy characteristics.
Seasonal Variability of Gulf Stream Eddies
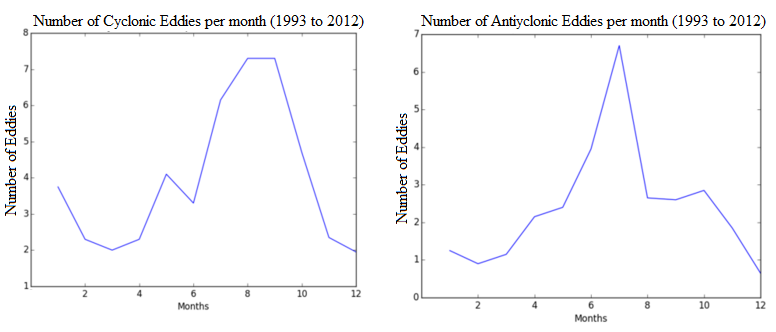
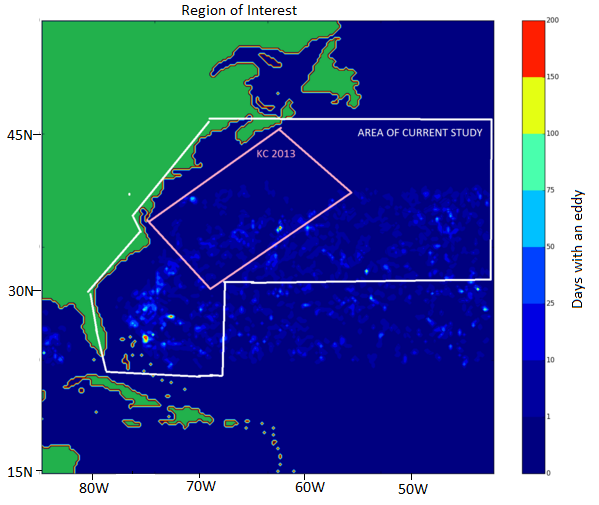
Gulf Stream eddies have been shown to exhibit a distinct seasonal cycle dependent upon wind forcing and the Gulf Stream’s proximity to the continental shelf. Wind stress in the Gulf Stream region exhibits a maximum in winter and a minimum in late summer into autumn (Fu et al., 1987) . The eddy kinetic energy (EKE) follows the seasonal changes in wind forcing by a few months (White and Heywood, 1995). According to Kang and Curchitser (2013), EKE follows a seasonal cycle with a maximum in spring/early summer and a minimum in autumn to winter for the Gulf Stream region. An analysis in the average number of eddies formed in each month over the 20 year period of 1993 to 2012 shows insight into how the ocean is converting energy into eddies. Figure 1 shows the seasonal cycle of eddy formation for both Gulf Stream cyclonic (left) and anticyclonic (right) eddies for the region in Figure 2.
Figure 1 - The seasonal cycle in number of cyclonic eddies (left) and anticyclonic eddies (right) over the period of 1993 to 2012.
Figure 2 - The region studied in Kang and Curchitser (2013) is outlined in pink as the northeastern part of the GS region and the region of current interest is in white.
The data from GLORYs is consistent with the Kang and Curchitser study (which will be referred to as KC 2013 herein) where there is a maximum in the number of cyclonic eddies towards the autumn months. In terms of anticyclonic eddies, the seasonal cycle in this study conflicts with the seasonal cycle uncovered in the 2013 paper. July was the most active month for anticyclonic eddies, contrasting KC 2013 which found more anticyclonic eddies in the autumn with no variation between cyclonic and anticyclonic eddies on the seasonal cycle. While KC 2013 studies the region of the Gulf Stream closest to the Atlantic Coast, the detection and tracking implemented in this paper includes the part of the Gulf Stream which separates from the coast and travels to the northeast, as well as the region extending to south of Cape Hatteras. Figure 2 highlights the differences between these two studies.
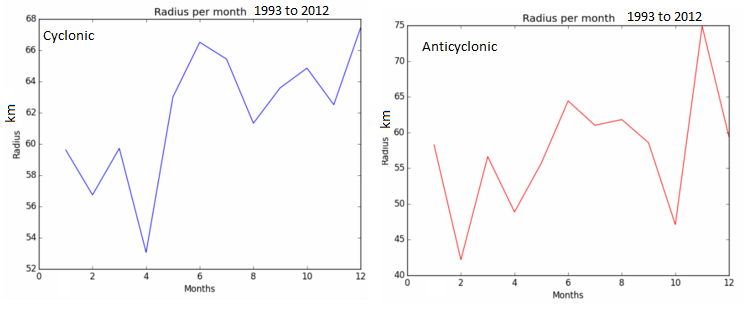
KC 2013 uncovered a distinct seasonal cycle in cyclonic and anticyclonic eddy radii for the region surveyed. Cyclonic radii were smallest in April, growing larger through the summer months and peaking in Autumn. Anticyclonic radii exhibited a minimum in May with a gradual increase through the summer months and leveling off into autumn. Differences between this study and KC 2013 were observed mostly with the radius of anticyclonic eddies on a seasonal cycle and are most likely due to eddies formed south of Cape Hatteras and in the north which were not within the region of interest in that study. Figure 3 shows the seasonal variability of cyclonic eddy radii and anticyclonic eddy radii between 1993 and 2012. Cyclonic eddy radii trends in this study are consistent with the trend found in KC 2013, with larger eddies found in in June and October and the smallest eddies in April.
Figure 3 - Seasonal variability of Gulf Stream eddy radii for 1993 to 2012.
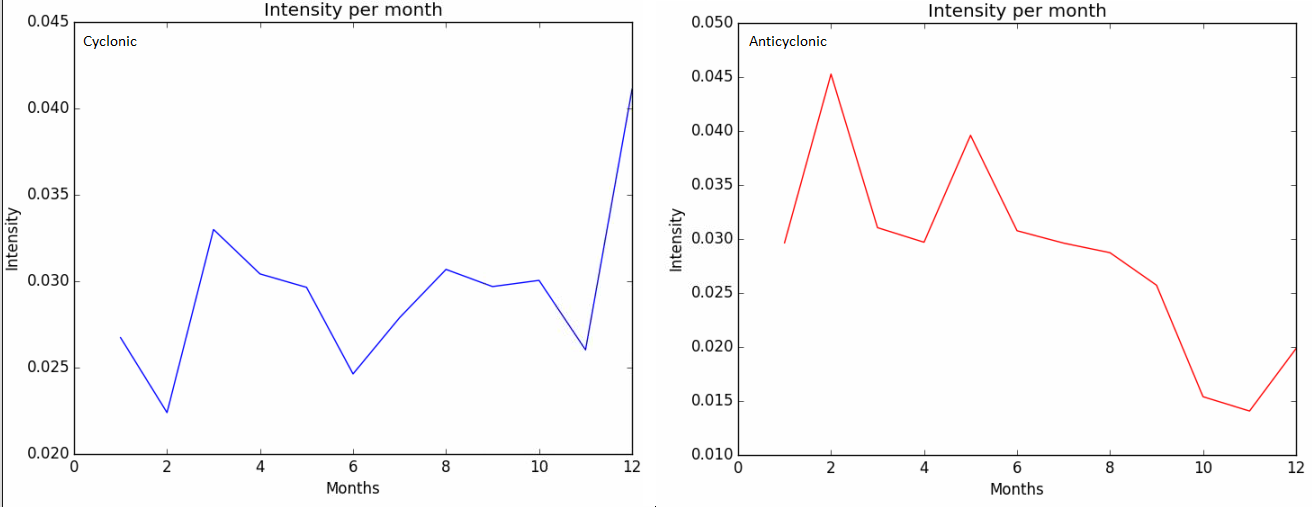
The intensity of cyclonic eddies is found by KC 2013 to peak in May and gradually decline throughout the year. Anticyclonic eddy intensity is similar, with a broad peak throughout the spring and a steady decline through the fall. Figure 4 shows that the data in this study is inconsistent with KC 2013’s findings. The seasonal variation in cyclonic intensity shows significant variability and no real trends. For anticyclonic intensity, the spring months are the most intense dropping off through the summer and autumn. The reasoning for the inconsistency can be attributed to slightly different regions of interest. This study includes the southern portion of the Gulf Stream, including areas upstream of the Charleston Bump, as well as more northern areas towards the North Atlantic Current. As a result, many of the eddies being tracked in this study are not as affected by continental shelf dynamics and are south of the greatest advection of EKE. Eddies to the south of the Charleston Bump differ in their characteristics due to slightly different formation processes.
Figure 4 - Seasonal variability of eddy intensity from 1993 to 2012.
Average anticyclonic eddy radii per month is variable. The largest anticyclonic eddies are found from May through August. During this same time, anticyclonic eddy intensity on average is decreasing until it hits its minimum in October. Coincidentally, one of the minimum anticyclonic eddy radius months is also October. The correlation between eddy radii and eddy intensity is not explicit. The Atlantic Ocean has been found to be in its most baroclinically unstable state during the winter months (Zhai, 2008). Baroclinic instability, which is the release of available potential energy previously built up, often leads to the formation of eddies (Zhai, 2008). EKE’s variation in space and time often gives insight into why the eddy intensity varies in the way it does. The seasonal variability of EKE in the Gulf Stream region is characterized by a peak in late winter early spring and a gradual decrease throughout the year, influencing the energy available through baroclinic processes for eddy formation. (Kang and Curchitser, 2013)
Interannual Variability of the Gulf Stream
Eddy characteristics such as number, radius, and intensity vary on interannual scales in the Gulf Stream region as well due to variations in the mean position of the Gulf Stream. Various mechanisms have been hypothesized to drive the Gulf Stream circulation on longer timescales. Proposed mechanisms include the variations in the southward flow of cold Labrador surface water, variations in the Deep Western Boundary Current (DWBC) which flows southward along the continental shelf, wind stress in response to variations in the NAO, and even the El Nino-Southern Oscillation. (Perez-Hernandez, 2014) The NAO accounts for approximately 60% of the total variance in the positioning of the Gulf Stream (Taylor et al., 1998). Therefore, a direct correlation between eddy characteristics, which in itself is a derivation of the positioning of the Gulf Stream as well as other factors with the NAO is unlikely.
The interannual variability of the Gulf Stream is mostly defined by how far the northern extent of the Gulf Stream reaches (Joyce et al., 2000). Little variation in surface velocity or width of the Gulf Stream was found on an interannual scale (Joyce et al., 2000). The role of the NAO in the positioning of the Gulf Stream was a tendency to shift the Gulf Stream south during low NAO phases and north during high NAO phases (Joyce et al., 2000). In this case, the Gulf Stream positioning is a function of the strength of the westerly winds. During a high NAO phase, on average the westerly winds are stronger over a particular season and weaker during a low phase. However, atmospheric forcing can be coupled with oceanic forcing. During cold winters, the Labrador Basin forces intrusions of Labrador surface water southward which have been shown to drive the Gulf Stream southward (Joyce et al., 2000).
Modulation of the position of the Gulf Stream can occur through mid-latitude atmospheric dynamics, intrusions of cold water, as well as tropical coupled atmospheric-oceanic dynamics through the El Nino-Southern Oscillation (ENSO). The warm phase of ENSO has been shown to impact global climate through modulations in the subtropical jet stream (Joyce et al., 2000). The warm phase of ENSO and its impact on the subtropical jet stream has been shown to result in a northward displacement of the Gulf Stream 1.5 years later (Perez-Hernandez, 2014) . Any climate mode that impacts mid-latitude wind forcing will impact the Gulf Stream’s mean position, thus impacting the spatial distribution and energetics of eddies formed from the Gulf Stream.
Variability in Gulf Stream Meandering Strength
Positioning of the Gulf Stream is one ingredient in determining the likelihood of eddy development. Gulf Stream meanders are the precursor to eddies and quantifying their temporal variability is important to the study of eddy variability. Gulf Stream meanders propagate eastward along with the flow of the Gulf Stream, which can excite Rossby waves and radiate energy into the eddy field westward (Lee and Cornillon, 1995). Variations in meandering strength may cause variations in eddy energy because surface transport varies with the meandering strength. Additionally, there is a weak correlation suggesting greater meandering intensity is more likely to occur in the southerly mode of the Gulf Stream (Lee and Cornillon, 1995).
Variability in Gulf Stream Eddy Characteristics
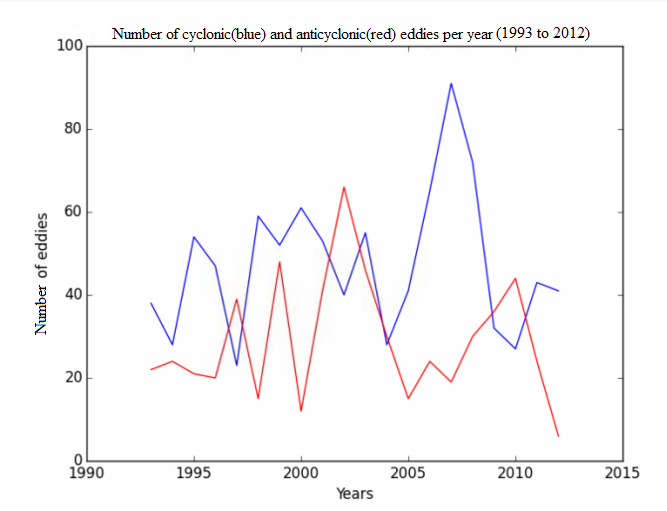
Figure 5 shows how the number of cyclonic and anticyclonic eddies has varied over the 20 year period. Prominent years where the number of cyclonic and anticyclonic eddies have starkly opposite trends include every year from 1994 to 2002. Between 2002 and 2004 the number of both types of eddies show similar trends. From 2005 to 2010, the number of anticyclonic eddies slowly rises. Cyclonic eddies follow a similar pattern between 2005 and 2007, only to begin a decline in 2008, falling in line with the idea that the two are negatively correlated. Because cyclonic eddies often form south of the Gulf Stream and drift southwest, a more northerly Gulf Stream benefits their formation over anticyclonic eddies. Anticyclonic eddies form north of the Gulf Stream, drifting northwest and a more southerly Gulf Stream provides more area for their formation.
Figure 5 - Number of cyclonic eddies (blue) and anticyclonic eddies (red) each year between 1993 and 2012.
The warm phase of ENSO, high phase of NAO, and lack of cold Labrador surface water will inhibit the formation of anticyclonic eddies. This is confirmed by Perez-Hernandez’s (2014) analysis of the Gulf Stream positioning where it was found that during July 1995, October 2000, and April 2012, the Gulf Stream was at its most northerly extent. During these years, anticyclonic eddies were limited in number. The years 1993 and 1998 were notable warm ENSO phase years, giving credence to the 1.5 year lag phase rule. Additionally, April 2012 was preceded by a very high NAO period from September 2011 to April 2012 and a falling cold ENSO phase. These climate modes interact in non-linear ways to produce fluctuations in the mean positioning of the Gulf Stream. While the number of eddies can be explained to some extent by Gulf Stream positioning, radius and intensity are more complicated.
Gulf Stream Eddy Intensity
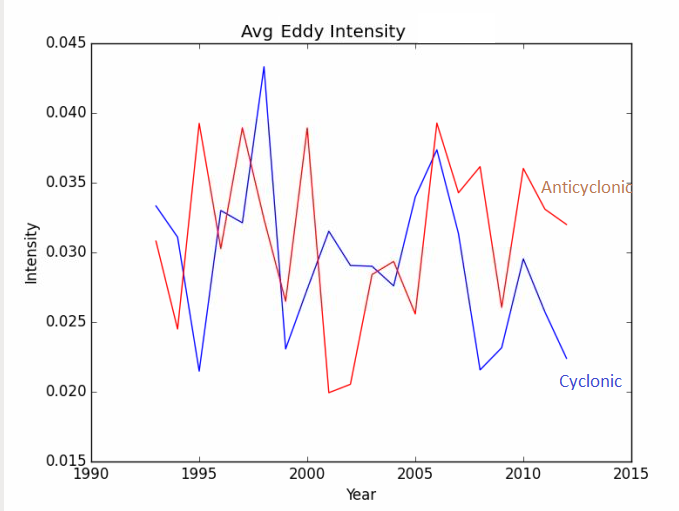
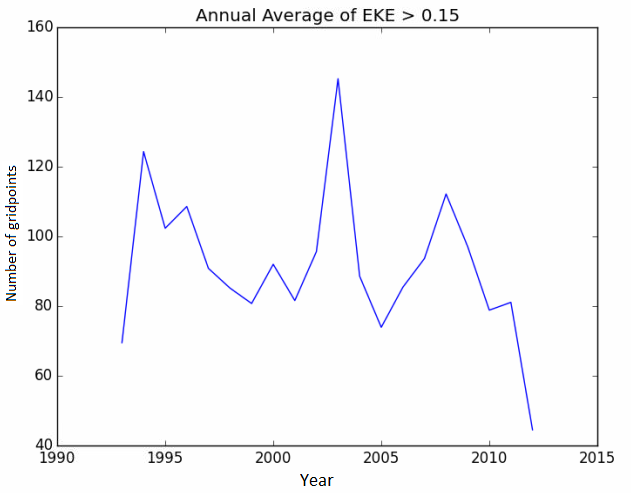
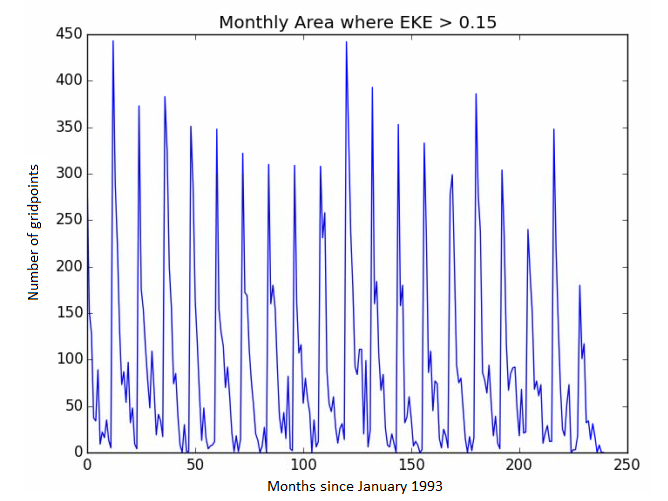
The intensity of the average cyclonic and anticyclonic eddy on an interannual scale is shown in Figure 6. Anticyclonic eddies are on average more intense but no clear relationship between cyclonic and anticyclonic intensity is present. The North Atlantic Oscillation on an interannual scale was not found to be correlated with changes in intensity on an interannual scale. Variations in EKE in the region are used to help explain variations in eddy intensity. However, changes in EKE were also found to have no strong correlation with the NAO. Figure 7 shows the area where EKE is greater than 0.15 J -3m-3 , a way to quantify the distribution as well as the amount of EKE. EKE peaks in January in every year, so variations in the maximum areas of EKE is clearly present. The largest EKE is mostly limited to the area of the Charleston Bump and just north of this. There is a downward trend in area of EKE greater than 0.15 from 1993 through to 2002. The year 2003 has the largest spatial area with an EKE of more than 0.15. From 2003 to 2012 the general trend is downward, indicating a possible decadal signal. There is no clean cut relationship between EKE and average eddy intensity because many of the eddies studied are upstream of the region with the most advection of EKE. Eddies south of the Charleston Bump do not experience great advection of EKE so their intensities are more variable and dependent on advection of the small, variable amounts of EKE within that region.
Figure 6 - Average intensity of cyclonic eddies (blue) and anticyclonic eddies (red) each year between 1993 and 2012.
Figure 7 - Number of gridpoints with an EKE greater than 0.15 J m-3 in the Gulf Stream region over the period from 1993 to 2012. (a) Annual average
(b) Monthly average
Gulf Stream Eddy Radius
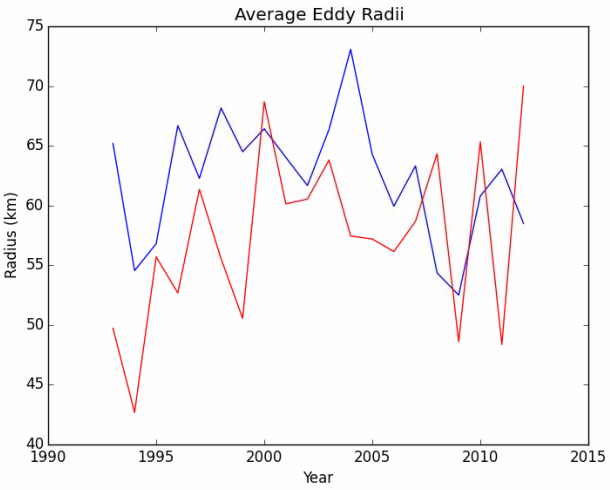
Over the 20 year period, cyclonic eddies are on average larger than anticyclonic eddies. The range of sizes averaged over any year is 42 km to 68 km for anticyclonic eddies and 54 km to 74 km for cyclonic eddies. Cyclonic eddies are observed to form by Gulf Stream meanders extending southward after deflections from the continental shelf. As a consequence of this deflection, cyclonic eddies were observed to be larger, especially during meandering phases. As eddy intensity and number were found to have no relationship with the NAO, variations in eddy radius per year also have no significant correlation with the NAO.
Figure 8 - Average radius of cyclonic eddies (blue) and anticyclonic eddies (red) over 1993 to 2012.
Gulf Stream Eddy Spatial Distribution
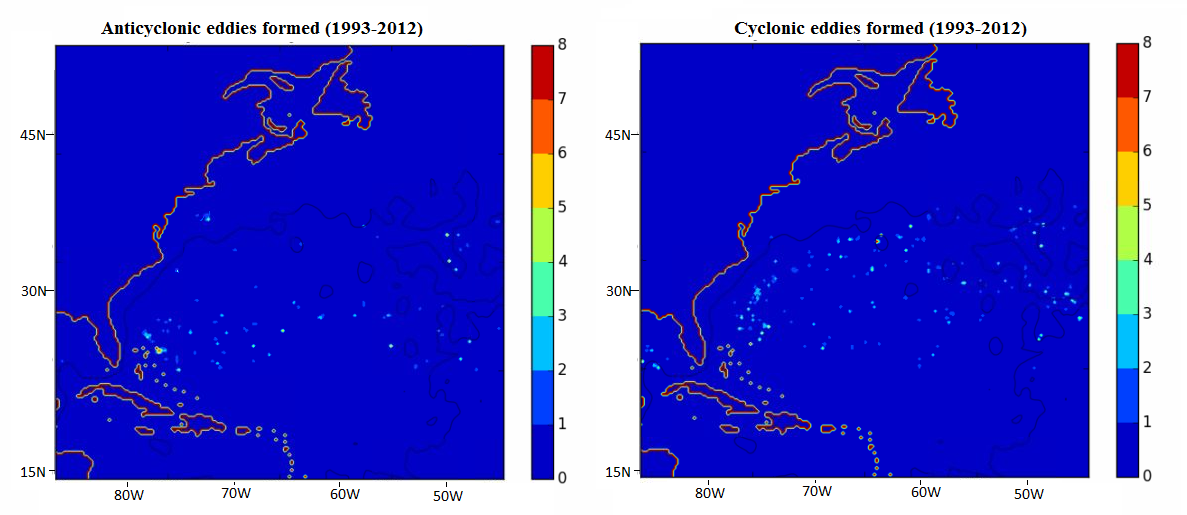
The eddies tracked in this study originate from a far larger area than the region studied in KC2013. Therefore, differences exist in the eddy statistics, highlighting eddy dynamics adhere regional differences. Figure 9 shows the spatial distribution of where eddies originate. The black contour is the 15 degree C isotherm at 200m averaged over the time period, an indirect indicator of the mean flow of the Gulf Stream (Taylor et al., 1998). Many eddies observed form just north of the Bahamas, upstream of the Charleston Bump. These eddies are not the traditional eddies studied as part of the Gulf Stream region and can behave like open ocean eddies. It was also noteworthy that many eddies formed in the middle of the North Atlantic away from the continental shelf, mostly by baroclinic instability and wind forcing, sometimes without the traditional breaking off of a Gulf Stream meander.
Figure 9- Number of anticyclonic eddies(left) and cyclonic eddies(right) formed at each grid point over the period 1993 to 2012.
Seasonal and Interannual Variability of Kuroshio Current Eddies
The interannual variability in eddy formation in this region has been discussed in terms of the two modes of the positioning of the Kuroshio Current, or its northward extent [Qiu, 2000; [Tai, White, et al., 1990]. Its positioning is induced by a change in volume transport, affected by the strength of the subtropical gyre in the North Pacific, modulating the intensity of the Kuroshio Current and how it interacts with the continental shelf (Sekine, 1994). The Izu-Ogasawara ridge in particular affects how cold core rings and warm core rings propagate as the winds in the Pacific Basin vary by season (Ihara et al., 2002). An increase in Kuroshio transport, which can be induced by a changing of winds over a long period of time, typically leads to the northward migration of the path of the current and a decrease leads to a southward migration (Qiu, 2000). Beyond wind stress, Oey et al., (2000) found evidence of wintertime cooling of the Pacific causing a northern shift in the path that the Kuroshio takes near Taiwan. As a result of these interannual and seasonal oscillations, mesoscale eddy activity undergoes significant modifications. In the meandering or southerly mode, eddy activity is increased (Qiu, 2000). The spatio-temporal variability of the Kuroshio Current is influenced by mesoscale eddies to such a large degree that longer term observations are necessary to determine the seasonal cycle.
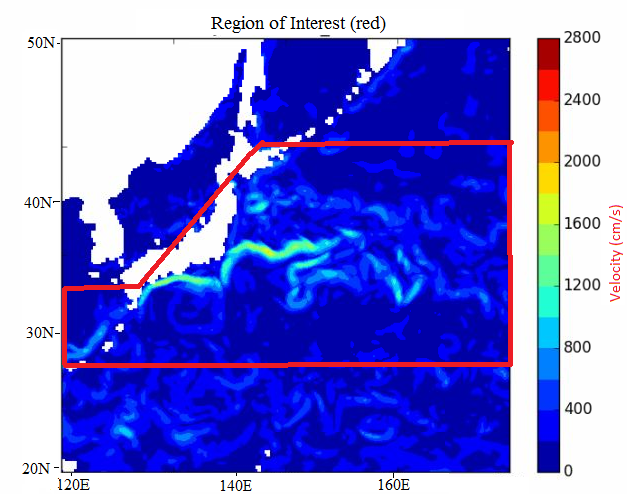
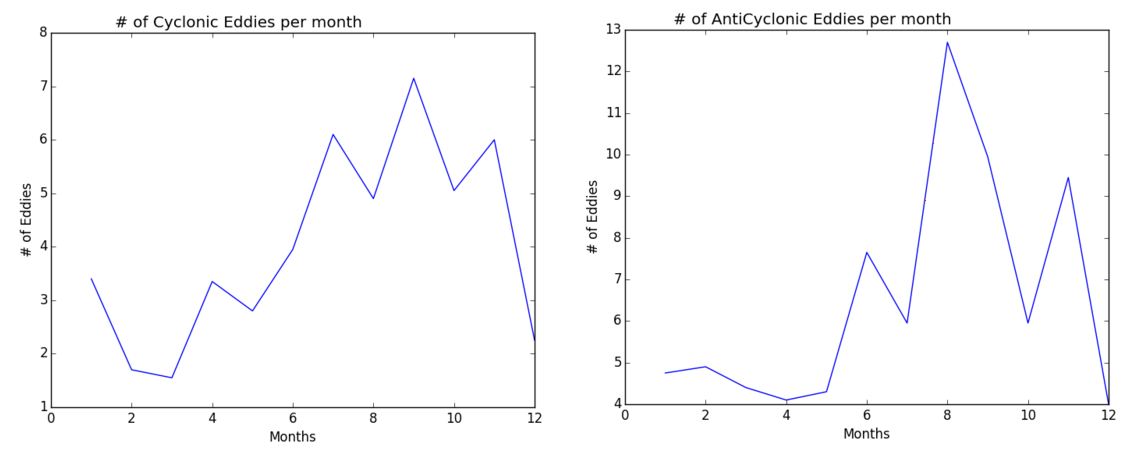
Because the oscillation of the positioning of the Kuroshio Current affects eddy activity in similar ways as the seasonal variation in winds, it is difficult to separate the two variations. The detection and tracking of the Kuroshio current was performed in the red area shown in Figure 10. The seasonal cycle in Kuroshio eddy number found in the GLORYs reanalysis is seen in Figure 11. Both cyclonic and anticyclonic eddies are more numerous during the late summer months into the early fall. Wei et al., (2015) found the Kuroshio mean current to be weakest in autumn, which contributes to the tendency for a more meandering Kuroshio Current, which could lead to more warm and cold core eddies. This is consistent to some extent to what was also discovered in the Gulf Stream region.
Figure 10 - The region studied to determine the eddy characteristics of the Kuroshio current.
Figure 11 - Monthly number of cyclonic (left) and anticyclonic (right) eddies in the Kuroshio Current. Based on data from 1993 to 2012.
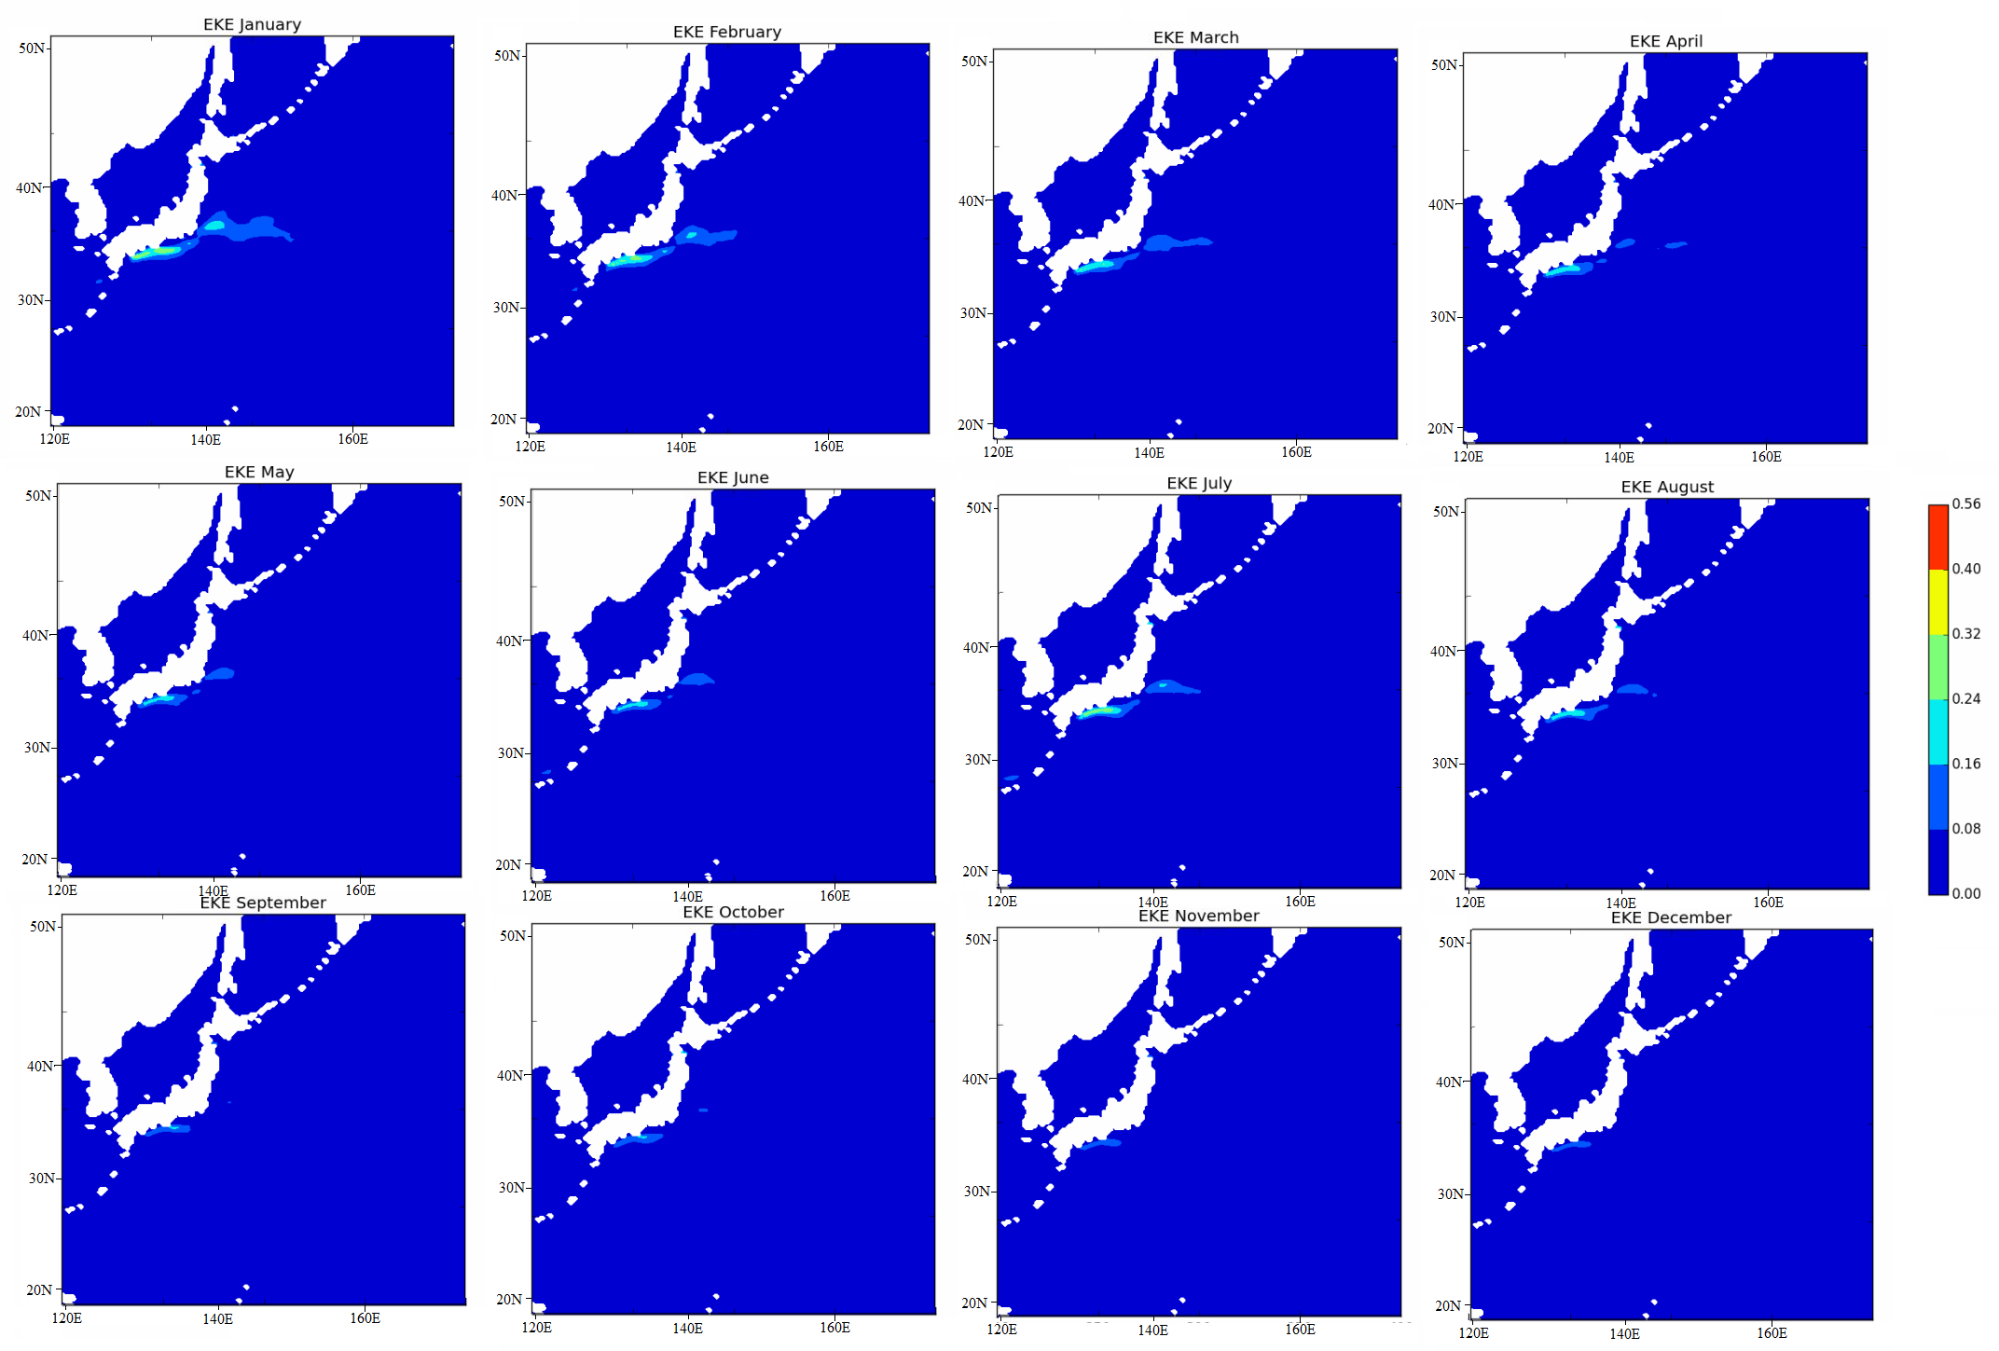
On a seasonal timescale, the intensity of eddies has been strongly correlated with Eddy Kinetic Energy (EKE). The EKE in the Kuroshio Current region is shown in Figure 12. The maximum EKE is found in the beginning of the year, decreasing as the year progresses. Qui (2001) finds that EKE variability is related to the Kuroshio current’s positioning. EKE is high in the region when the Kuroshio current is more northerly and volume transport is stronger. EKE is lower when the Kuroshio has a more southerly extent and weaker transport. These findings were a result of the ocean’s internal eddy heat fluxes, not through wind forcing. This was also observed in the GLORYs dataset. An external climatology of the Kuroshio current from other studies were used to compare the eddy statistics determined from the eddy detection and tracking algorithm described earlier.
Figure 12- Monthly Eddy Kinetic Energy in the Kuroshio Current just southeast of Japan.
Cyclonic Kuroshio Eddy Characteristics
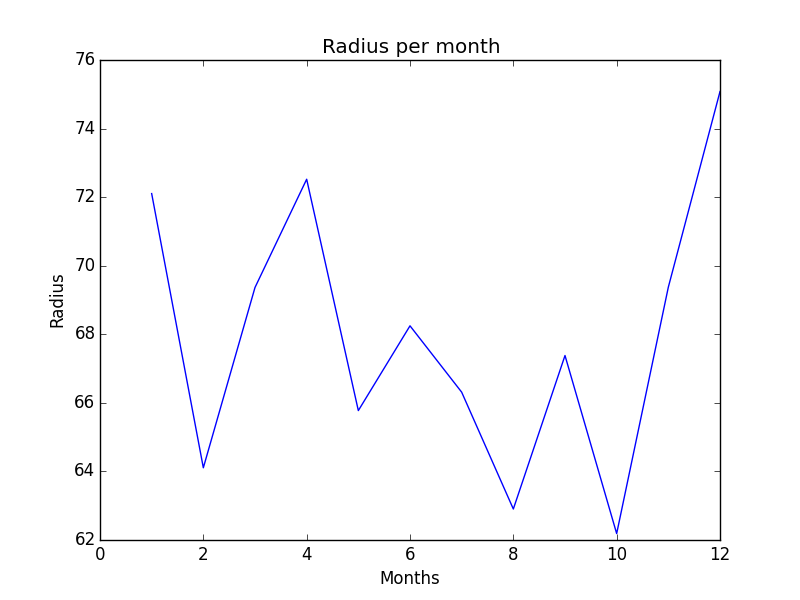
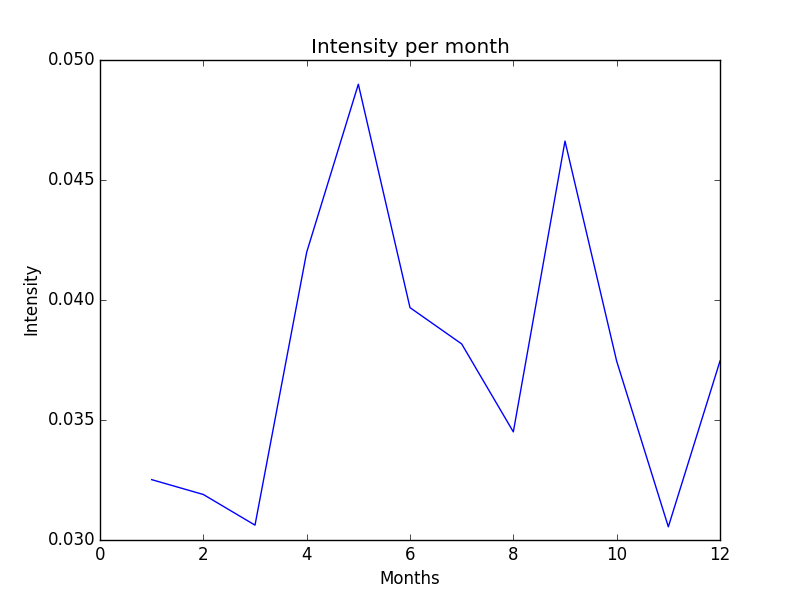
Other than eddy number, cyclonic eddy characteristics such as size (radius) and intensity were found to have significant variability. The monthly variation in eddy radius over the 20 year period of 1993 to 2012 is shown in Figure 13. Cyclonic eddies are largest in April. Through the summer months, the average eddy radius decreases, only to spike up again towards December. No clear trend was discernible from the cyclonic eddies tracked over this time period. The seasonal variation in eddy intensity over the 20 year period of 1993 to 2012 is shown in Figure 14. While April is the month with some of the largest sized cyclonic eddies, May appears to be the month with the most intense cyclonic eddies. As the summer months arrive, cyclonic eddy intensity decreases dramatically, only to express a very large amount of variability into autumn. Cyclonic, or cold core, southwesterly propagating eddies tend to have weak seasonal trends with peaks in spring and autumn.
Figure 13- Monthly variations in cyclonic eddy radii in the Kuroshio current region.
Figure 14- Monthly variations in cyclonic eddy intensity in the Kuroshio current region.
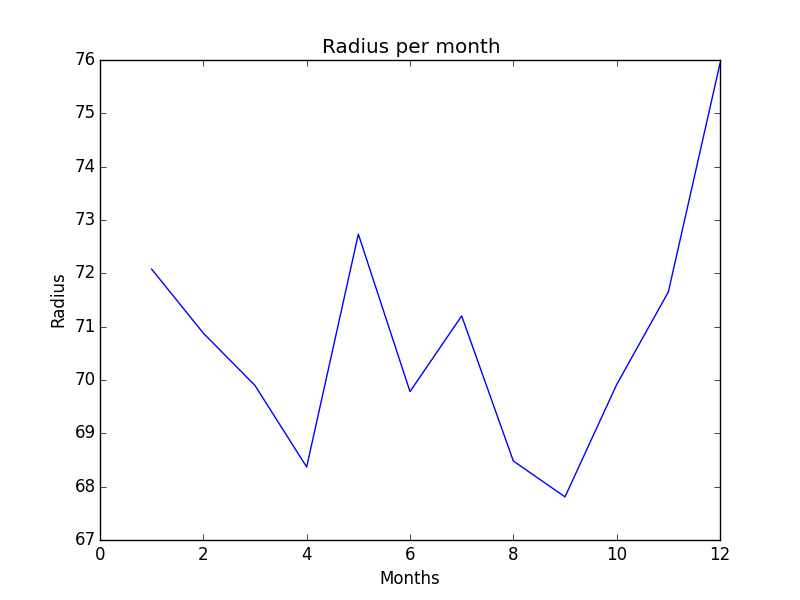
Anticyclonic Kuroshio Eddy Characteristics
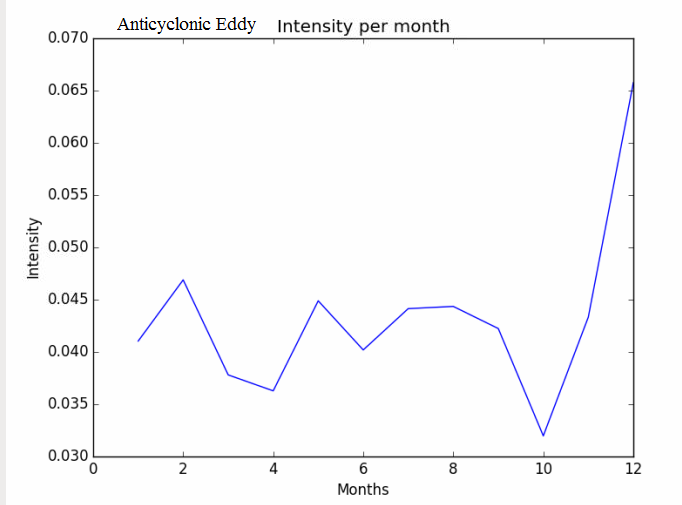
Anticyclonic, or warm core eddies rotating clockwise have similar trends in seasonal numbers compared to cyclonic eddies, despite different spatial distributions. Anticyclonic eddies are most numerous in August while cyclonic eddies are most numerous in September. The difference is small as both types of eddies follow the same general seasonal variations. This implies that changes in Kuroshio current circulations affect both northward and southward propagating eddies in similar ways. Anticyclonic eddies are largest in May and December, as shown in Figure 15. Following a peak in May, eddies that form in the summer months through September are progressively smaller. In October, this trend reverses and eddies grow to their largest extent. In terms of intensity, anticyclonic eddies have a peaking intensity in May, which happens to be one of the peaks in eddy radii (Figure 16).
Figure 15- Anticyclonic eddy variations in size per month in the Kuroshio current region.
Additionally, intensity stays consistently high throughout the late summer and early autumn months. At this time these eddies are decreasin in size. The implication is that the eddy kinetic energy in the region for the months transitioning from summer to autumn is distributed into more small and intense eddies. At the peak of summer, this implies the Kuroshio current is weak and meandering. According to Sekine and Kutsuwada (1994), the minimum transport for the Kuroshio south of Japan is found in summer to early autumn. Thus, the eddy characteristics are consistent with this finding which characterizes the flow during this time as weak and meandering. The high eddy intensity through autumn can be explained when it is shown that September is also a month of very small eddies. Many of the eddies formed in August are observed to interact with the continental shelf and/or growing smaller and reorganizing their vortex core into a very small, intense structure.
NEW Figure 16: Seasonal variations in intensity for anticyclonic eddies in the Kuroshio region.
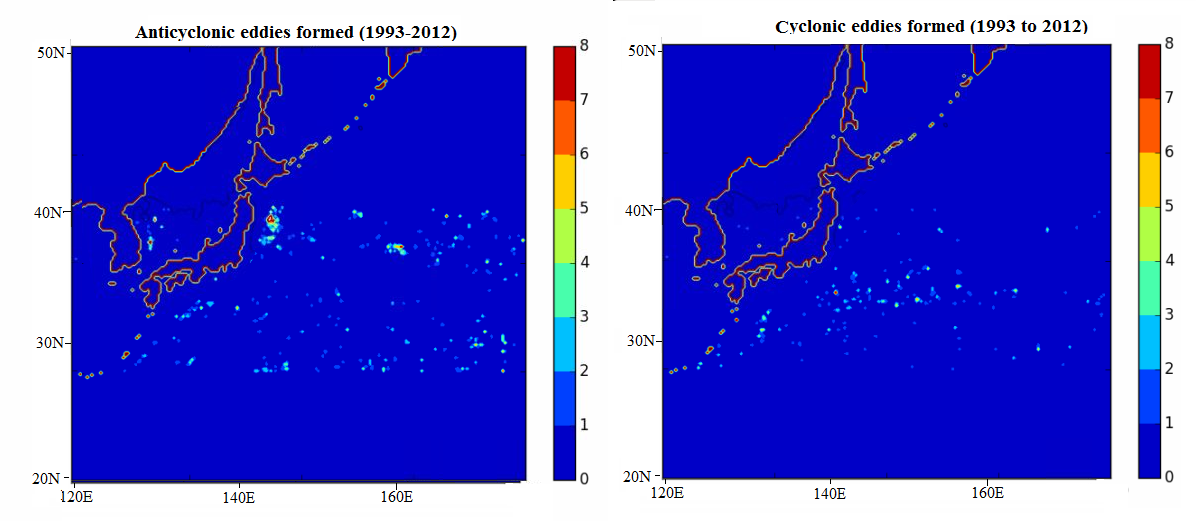
Spatial Distribution
The distinction between origination areas of anticyclonic and cyclonic eddies is clear in Figure 17. Cyclonic eddies typically form south of the Kuroshio current while anticyclonic eddies form to the north, clustered just east of Iwate. Anticyclonic eddies are thus more impacted by the bottom topography, and their generation is a function of this interaction more so than baroclinic forcing. Cyclonic eddies form through meandering further from land towards the open ocean, generally increasing the biological productivity of these areas.
Figure 17- Number of eddies formed at each gridpoint in the Kuroshio current region over the period 1993 to 2012.
Conclusions
Gulf Stream eddies are a product of wind forcing, bottom topographical forcing, the advection of Rossby waves, and baroclinic instability. The argument can be made that the NAO influences interannual Gulf Stream eddy characteristics, but there is no statistical relationship to justify this. The NAO accounts for 60% of the variance of the Gulf Stream position, which influences the characteristics of Gulf Stream eddies but is not the only factor. Variations in eddy characteristics are explained seasonally by EKE variability to some extent, in that the early spring/winter is a time with more eddies. However, the larger scale fluctuations in Gulf Stream positioning by ENSO, the NAO, or cold water in the Labrador basin can dwarf the seasonal variability.
The Kuroshio current is very similar to the Gulf Stream in that a meandering mode increases eddy activity. The bimodal north-south distribution is more pronounced in the Kuroshio current. The southerly mode of the Kuroshio current is more correlated with meandering than the southerly mode of the Gulf Stream. The northerly or southerly extent is more correlated with changes in surface transport and can increase or decrease eddy activity in general through more or less meandering. Inquiries into why the Kuroshio current is more susceptible to meandering fluctuations with a more southerly state would be speculation at best. Dukstra (2011) determined that the bottom topography of the Kuroshio current region helps to induce the transition between the meandering and non-meandering mode. Additionally, the DWBC in the Pacific is much weaker due to the Izu ridge near Japan (Dukstra, 2011). The correlation between a large sale atmospheric and oceanographic climate modes and eddy characteristics is strongly suggested given the similarities between the Kuroshio and Gulf Stream systems.
Both the Gulf Stream and Kuroshio currents were observed to exhibit significant variability in cyclonic and anticyclonic eddy characteristics that could be linked to variations in the position of the current in which the eddies are associated with. Understanding that there are less anticyclonic eddies breaking off from a western boundary current when it is in a more northern phase has the potential to enhance the predictability of intrusions of warm Sargasso Sea water onto the continental shelf. The spatial distribution of eddies over the 20 year period studied assists in understanding where eddies are more likely to propagate, contributing to the qualitative knowledge of eddy heat fluxes and biological productivity. As both the Gulf Stream and Kuroshio currents drive world climate, it is important to develop a thorough understanding of their eddy dynamics, which contribute significantly to variability in the currents themselves (Joyce et al., 1999).
References
Barnston, A. G., and R. E. Livezey, 1987: Classification, seasonality and persistence of low-frequency atmospheric circulation patterns. Mon. Wea. Rev., 115, 1083-1126.
Chaudhuri, A. H., A. Gangopadhyay, and J. J. Bisagni (2009), Interannual variability of Gulf Stream warm-core rings in response to the North Atlantic Oscillation, Cont. Shelf Res., 29, 856–869.
Chelton, D. B., M. G. Schlax, R. M. Samelson, and R. A. de Szoeke (2007), Global observations large oceanic eddies, Geophys. Res. Lett., 34, L15606, doi:10.1029/2007GL030812.
Climate Prediction Center - Teleconnections: North Atlantic Oscillation. (n.d.). Retrieved May 1, 2015, from http://www.cpc.ncep.noaa.gov/products/precip/CWlink/pna/nao.shtml
Ferry, N., Parent, L., Barnier, B., et al(2009).GLORYS2V1 Global Ocean Reanalysis of the Altimetric Era (1993 to 2009) at Mesoscale., Mercator Ocean - Quarterly Newsletter.
Ihara, C., Kagimoto, T., Masuoto, Y., Yamagata, T. 2002. Eddy Formation Near the Izu-Ogasawara Ridge and its Link with Seasonal Adjustment of the Subtropical Gyre in the Pacific. Journal of the Korean Society of Oceanography. Vol 37.
Isern-Fontanet, J., E. Garcıa-Ladona, and J. Font (2003), Identification of marine eddies from altimetric maps, J. Atoms. Oceanic Technol., 20, 772–778.
Joyce, T., Deser, C., Spall, M. 1999. The Relation between Decadal Variability of Subtropical Mode Water and the North Atlantic Oscillation. Journal of Climate, 13. 2250-2569.
Kang, D., and E. N. Curchitser (2013), Gulf Stream eddy characteristics in a high-resolution ocean model, J. Geophys. Res. Oceans, 118, 4474–4487, doi:10.1002/jgrc.20318.
Kang, D., and E. N. Curchitser (2015), Energetics of Eddy-Mean Flow Interactions in the Gulf Stream Region, J. Physical Oceanography, 45, 1103–1120.
Lee, T. and Cornillon, P. 1995. Temporal variation of meandering intensity and domain-wide lateral oscillations of the Gulf Stream. Journal of Geophysical Research, 100. 603-613.
Morrow, R., F. Birol, D. Griffin, and J. Sudre (2004), Divergent pathways of cyclonic and anti-cyclonic ocean eddies, Geophys. Res. Lett., 31, L24311, doi:10.1029/2004GL020974.
Perez-Hernandez, M., Joyce, T. 2014. Two Modes of Gulf Stream Variability Revealed in the Last Two Decades of Satellite Altimeter Data. Journal of Physical Oceanography 44: 149-163.
Qiu B. 2000. Interannual variability of the Kuroshio Extension system and its impact on the wintertime SST field. Journal of Physical Oceanography 30: 1486–1502.
Sekine, Y., and K. Kutsuwada, 1994: Seasonal variation in volume transport of the Kuroshio south of Japan. J. Phys. Oceanogr., 24, 261–272
Tai, C., and White, 1990: Eddy variability in the Kuroshio Extension as revealed by satellite altimetry: Energy propagation away from the jet, Reynolds stress, and seasonal cycle. J. Phys.
Oceanogr., 20, 1761-1777.
Taylor, A. H., M. B. Jordan, and J. A. Stephens, 1998: Gulf Stream shifts following ENSO events. Nature, 393, 638–638.
Wei, Y., Pei, Y., Zhang, R. 2015. Seasonal variability of the Kuroshio Current at the PN Section in the East China Sea based on in-situ observation from 1987 to 2010. Acta Oceaonologica Sinica. Vol 34, 12-21.
Zhai, X., R. J. Greatbatch, and J.-D. Kohlmann (2008), On the seasonal variability of eddy kinetic energy in the Gulf Stream region, Geophys. Res. Lett., 35, L24609, doi:10.1029/2008GL036412.